
We’ve reviewed in this essay series historical infectious disease mortality, and the introduction (or lack thereof) of widespread vaccination for various diseases in England and Wales, in Australia, and in the USA (we reviewed this in Part 2: Apostasy).
We’ve seen how the historical data available for these countries directly contradicts the messages preached by the Vaccine Evangelists (we reviewed their preaching in Part 1: The Evangelists).
We went on to explore the major differences between mortality and morbidity data, and we deconstructed our first case example of Vaccine Apologetics in Part 3: The Red Herring a Tour of the Motte.
Here in Part 4, we’ll broaden the picture even further and add another country to our analysis. We’ll look at historical infectious disease mortality for Spain.
~ End of Recap ~
Spain has national, detailed cause of death data from the year 1900 onward. As with the other countries we have looked at, a drastic plummet in deaths attributed to infectious disease occurs in Spain in the 20th century. For Spain too, we can see that clearly vaccines could not have been the primary reason, nor one of the primary reasons for this decline. The central misconception of the Doctrine of Salvation Through Vaccination* is preached in Spain just as it is almost everywhere else, yet it is just as untrue for Spain as it is for the English-speaking world.
For many of the major diseases, including the deadliest diseases in Spain during the 20th century, there was no vaccination. For many other diseases the vaccine came after almost all the decline in mortality had already occurred; only for a small portion of the diseases are the relevant vaccines introduced in Spain before the majority of the decline in mortality had yet to occur.
An interesting feature of the Spanish data is that many vaccines were introduced later in Spain then what they were in the English-speaking countries (especially compared to the USA and Australia which were early adopters of many vaccines). For example: routine whooping cough and diphtheria vaccination began in Spain in 1965; that’s around 17 years later than in the USA; measles vaccines were introduced in Spain in 1978; that’s 15 years later than when they were introduced in the USA. This means, as we will see, that an even greater portion of Spain’s 20th century reduction in mortality for certain infectious diseases occurred before widespread vaccination.
For those short on time feel free to scroll through this essay and peruse the many graphical layouts of the Spanish mortality data to take it in at a glance.
(* The central misconception of the Doctrine of Salvation Through Vaccination being:
The belief that vaccines played a primary role in causing the drastic decline in deaths attributed to infectious disease in general, and many major diseases in particular, that occurred in the late 19th and early 20th centuries, especially as this relates to the plummet in infant and child mortality rates; and also, the corollary belief that, these diseases would return with comparable devastation if we stopped vaccination against them.
See Part 1 of this essay series [The Evangelists] for extensive examples and documentation of Vaccine Evangelists promoting the central misconception of the Doctrine of Salvation Through Vaccination, as well as the second section of this essay installment)
Introductory Notes:
- Numbering of figures in this essay installment starts at Figure 26 as the last essay installment left off at Figure 25. Labeling of exhibits of Vaccine Evangelism starts at Exhibit M in this installment, as our first exhibition of Vaccine Evangelism in the Part 1: The Evangelists left off at Exhibit L.
- I previously stated that this fourth installment of this essay series would review mortality data across multiple countries in mainland Europe, but have decided to focus this installment on just one country, Spain, so that the analysis presented can be more methodical without being overly long (by covering more diseases in one country rather than fewer diseases across multiple countries).
Table of Contents for Part 4 – Spanish Death Data
- Putting the Spanish Data into Perspective
- Should we look at the data as the actual number of recorded deaths or as the death rate per 100,000 – what gives us a clearer picture for Spain? Plus population and yearly number of births over time for Spain.
- Infant Mortality Rate for Spain.
- The diseases ranked from most to least deadly for 20th century Spain.
- Vaccine Evangelism in Spain
- Whooping Cough Mortality and Vaccines in Spain – Exhibits M through P
- Child Mortality in Spain + a Lifespan Lecture – Exhibits Q through T.
- Graphical profile of 20th century mortality in Spain for individual diseases, and coverage of their respective vaccines or lack thereof
- Diarrhea and Enteritis
- Tuberculosis
- Pneumonia
- Bronchitis
- Meningitis
- Flu
- Measles
- Typhoid Fever
- Diphtheria
- Whooping Cough
- Scarlet Fever
1 – Putting the Spanish Data into Perspective
I want to provide the reader a big picture view of Spanish mortality and mortality data before we look at the details. These are some basic things I myself wanted to know in order to paint a bigger picture to provide context and perspective when viewing the mortality trends of the individual diseases.
Should we look at the data as the actual number of recorded deaths or as the death rate per 100,000 – what gives us a clearer picture for Spain? Plus, population and yearly number of births over time for Spain. (Nerd Warning! This is a fine point that matters to me, but might not to you; If this question you find dull, go ahead and skip ahead to the Infant Mortality Rate for Spain.)
For some of the Spanish data, source documents provide the data in two forms giving us the option of looking at it as the actual number of recorded deaths, or we can look at it as the rate of death per 100,000 living people.
In certain cases, the rate per 100,000 gives us a more accurate picture because the population of Spain more than doubled during the 19th century, from 18.6 million in 1900 to 39.4 million in 1999.
Figure 26
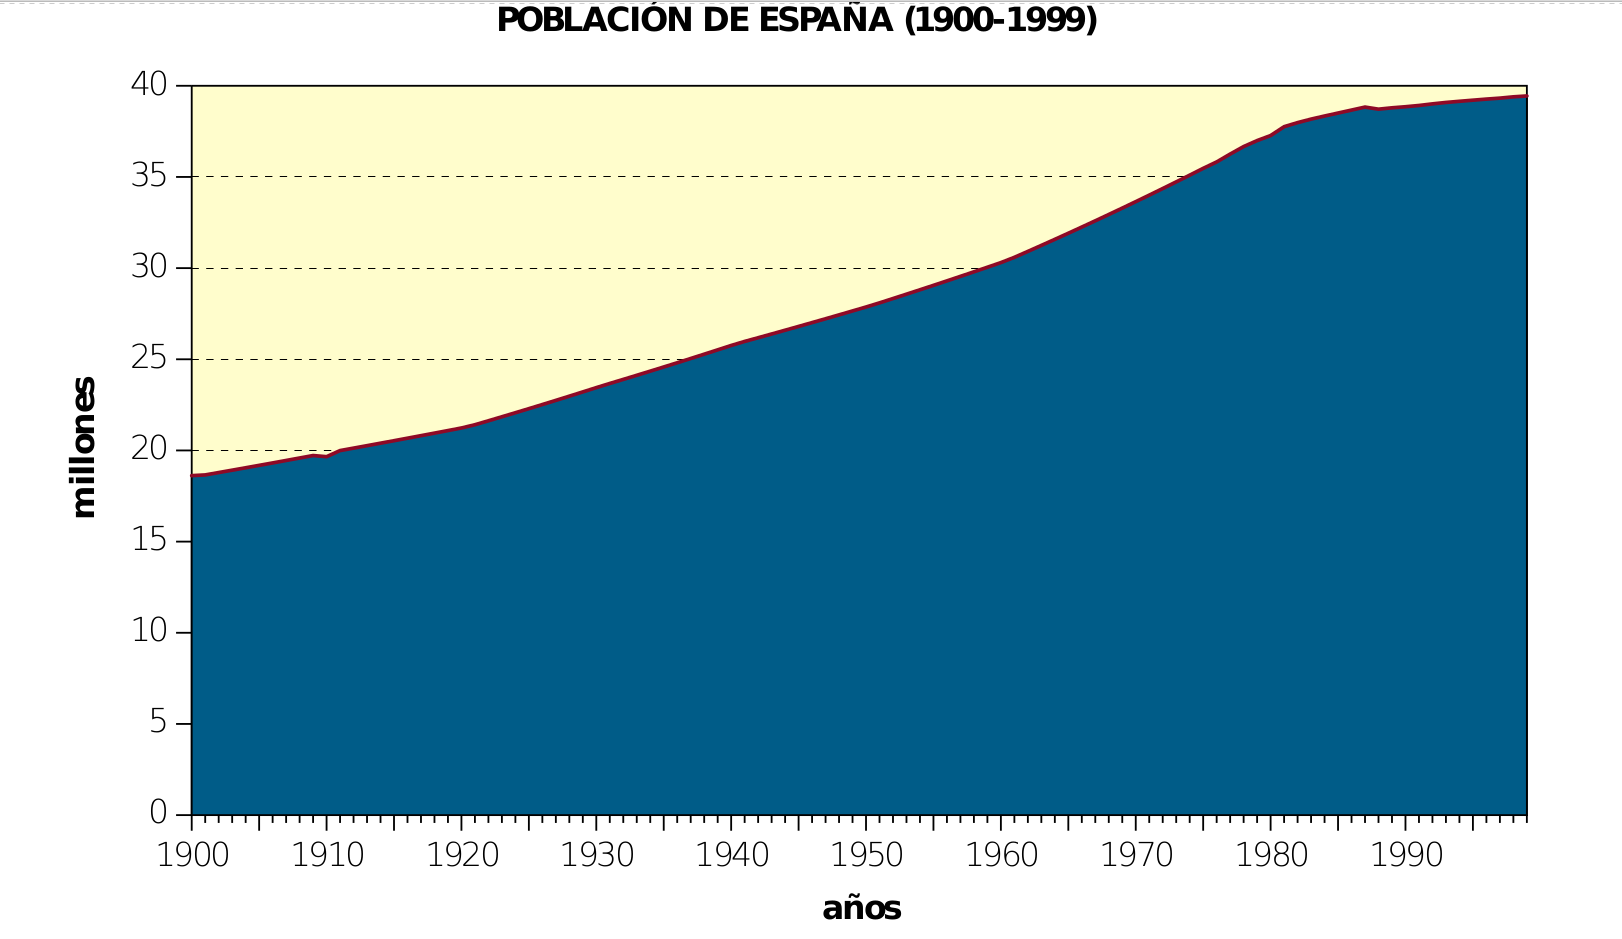
Figure 26 is a screenshot from page 36 of ANÁLISIS DE LA SANIDAD EN ESPAÑA A LO LARGO DEL SIGLO XX.
But in other cases, the rate of death per hundred thousand could distort the picture slightly, because while the population of Spain doubled in the 20th century, the number of children did not. The graph below, figure 27, shows us the number of births per year in Spain over the 20th century.
Figure 27
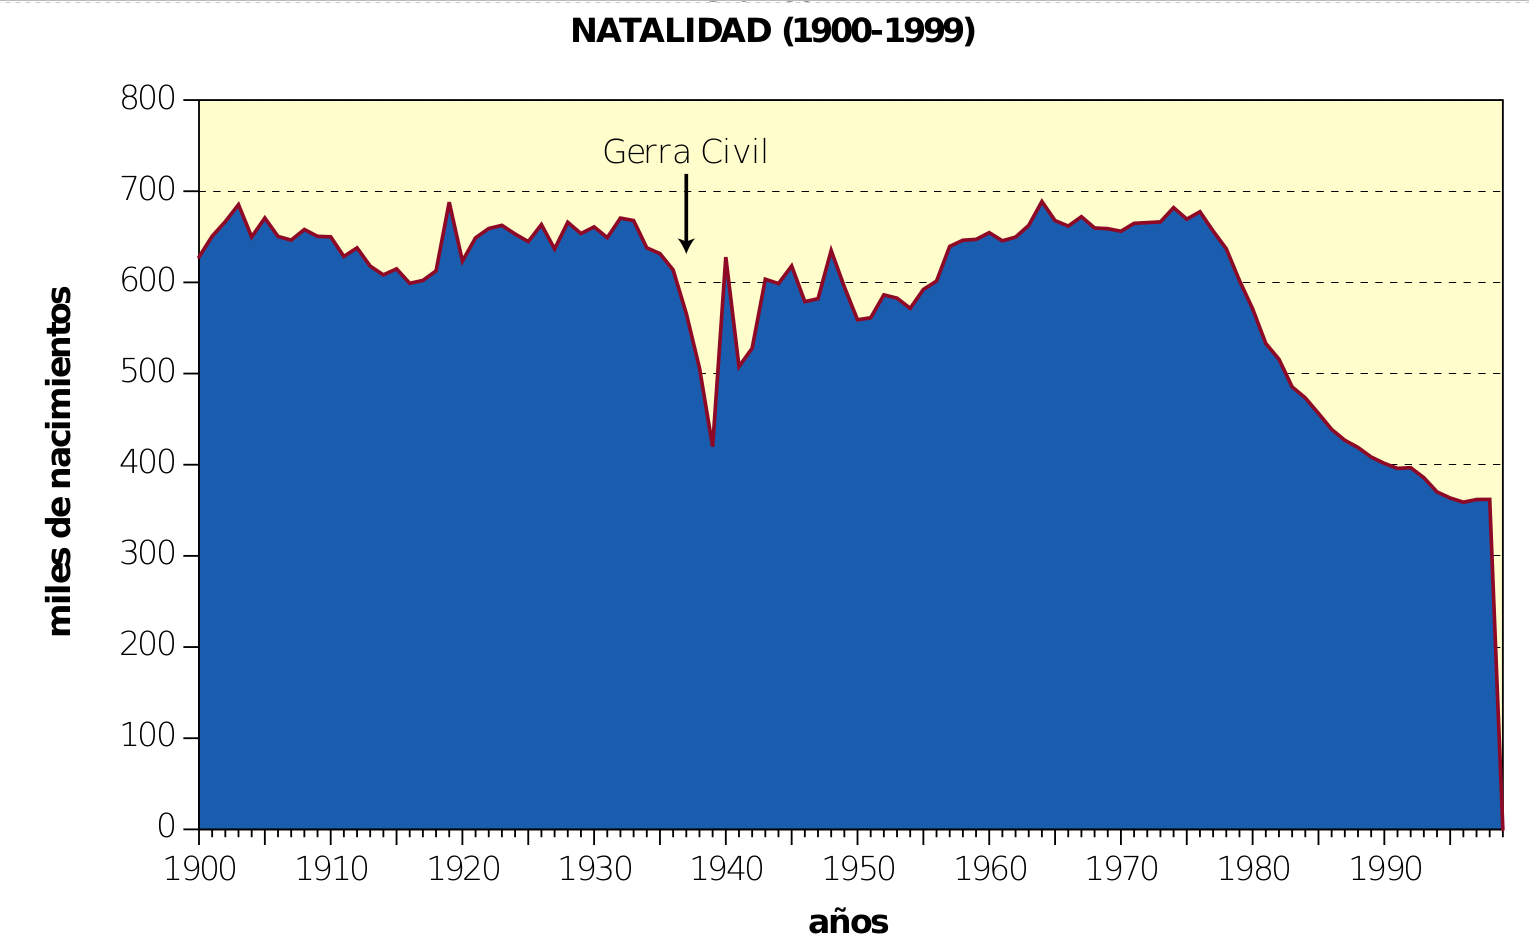
Figure 27 is also a screenshot from page 36 of ANÁLISIS DE LA SANIDAD EN ESPAÑA A LO LARGO DEL SIGLO XX.
From 1900 through the 1970s between 600,000 and 700,000 children were born in Spain each year (with the exception of the Spanish Civil War [1936-39] and the years immediately after it).
The rate of death per hundred thousand living would slightly distort the picture for diseases that primarily affected children because the growing adult population would dilute the death rate even though the number of children being born each year was holding relatively steady across an 80-year period.
So, for diseases that were primarily associated with child mortality, we will look at the actual number of recorded deaths per year over time.
For diseases that were associated with mortality in adults, as much or more so than children, we will look at the death rate per 100,000 living over time, as this will take into account the doubling of the population.
Infant Mortality Rate for Spain.
Figure 28
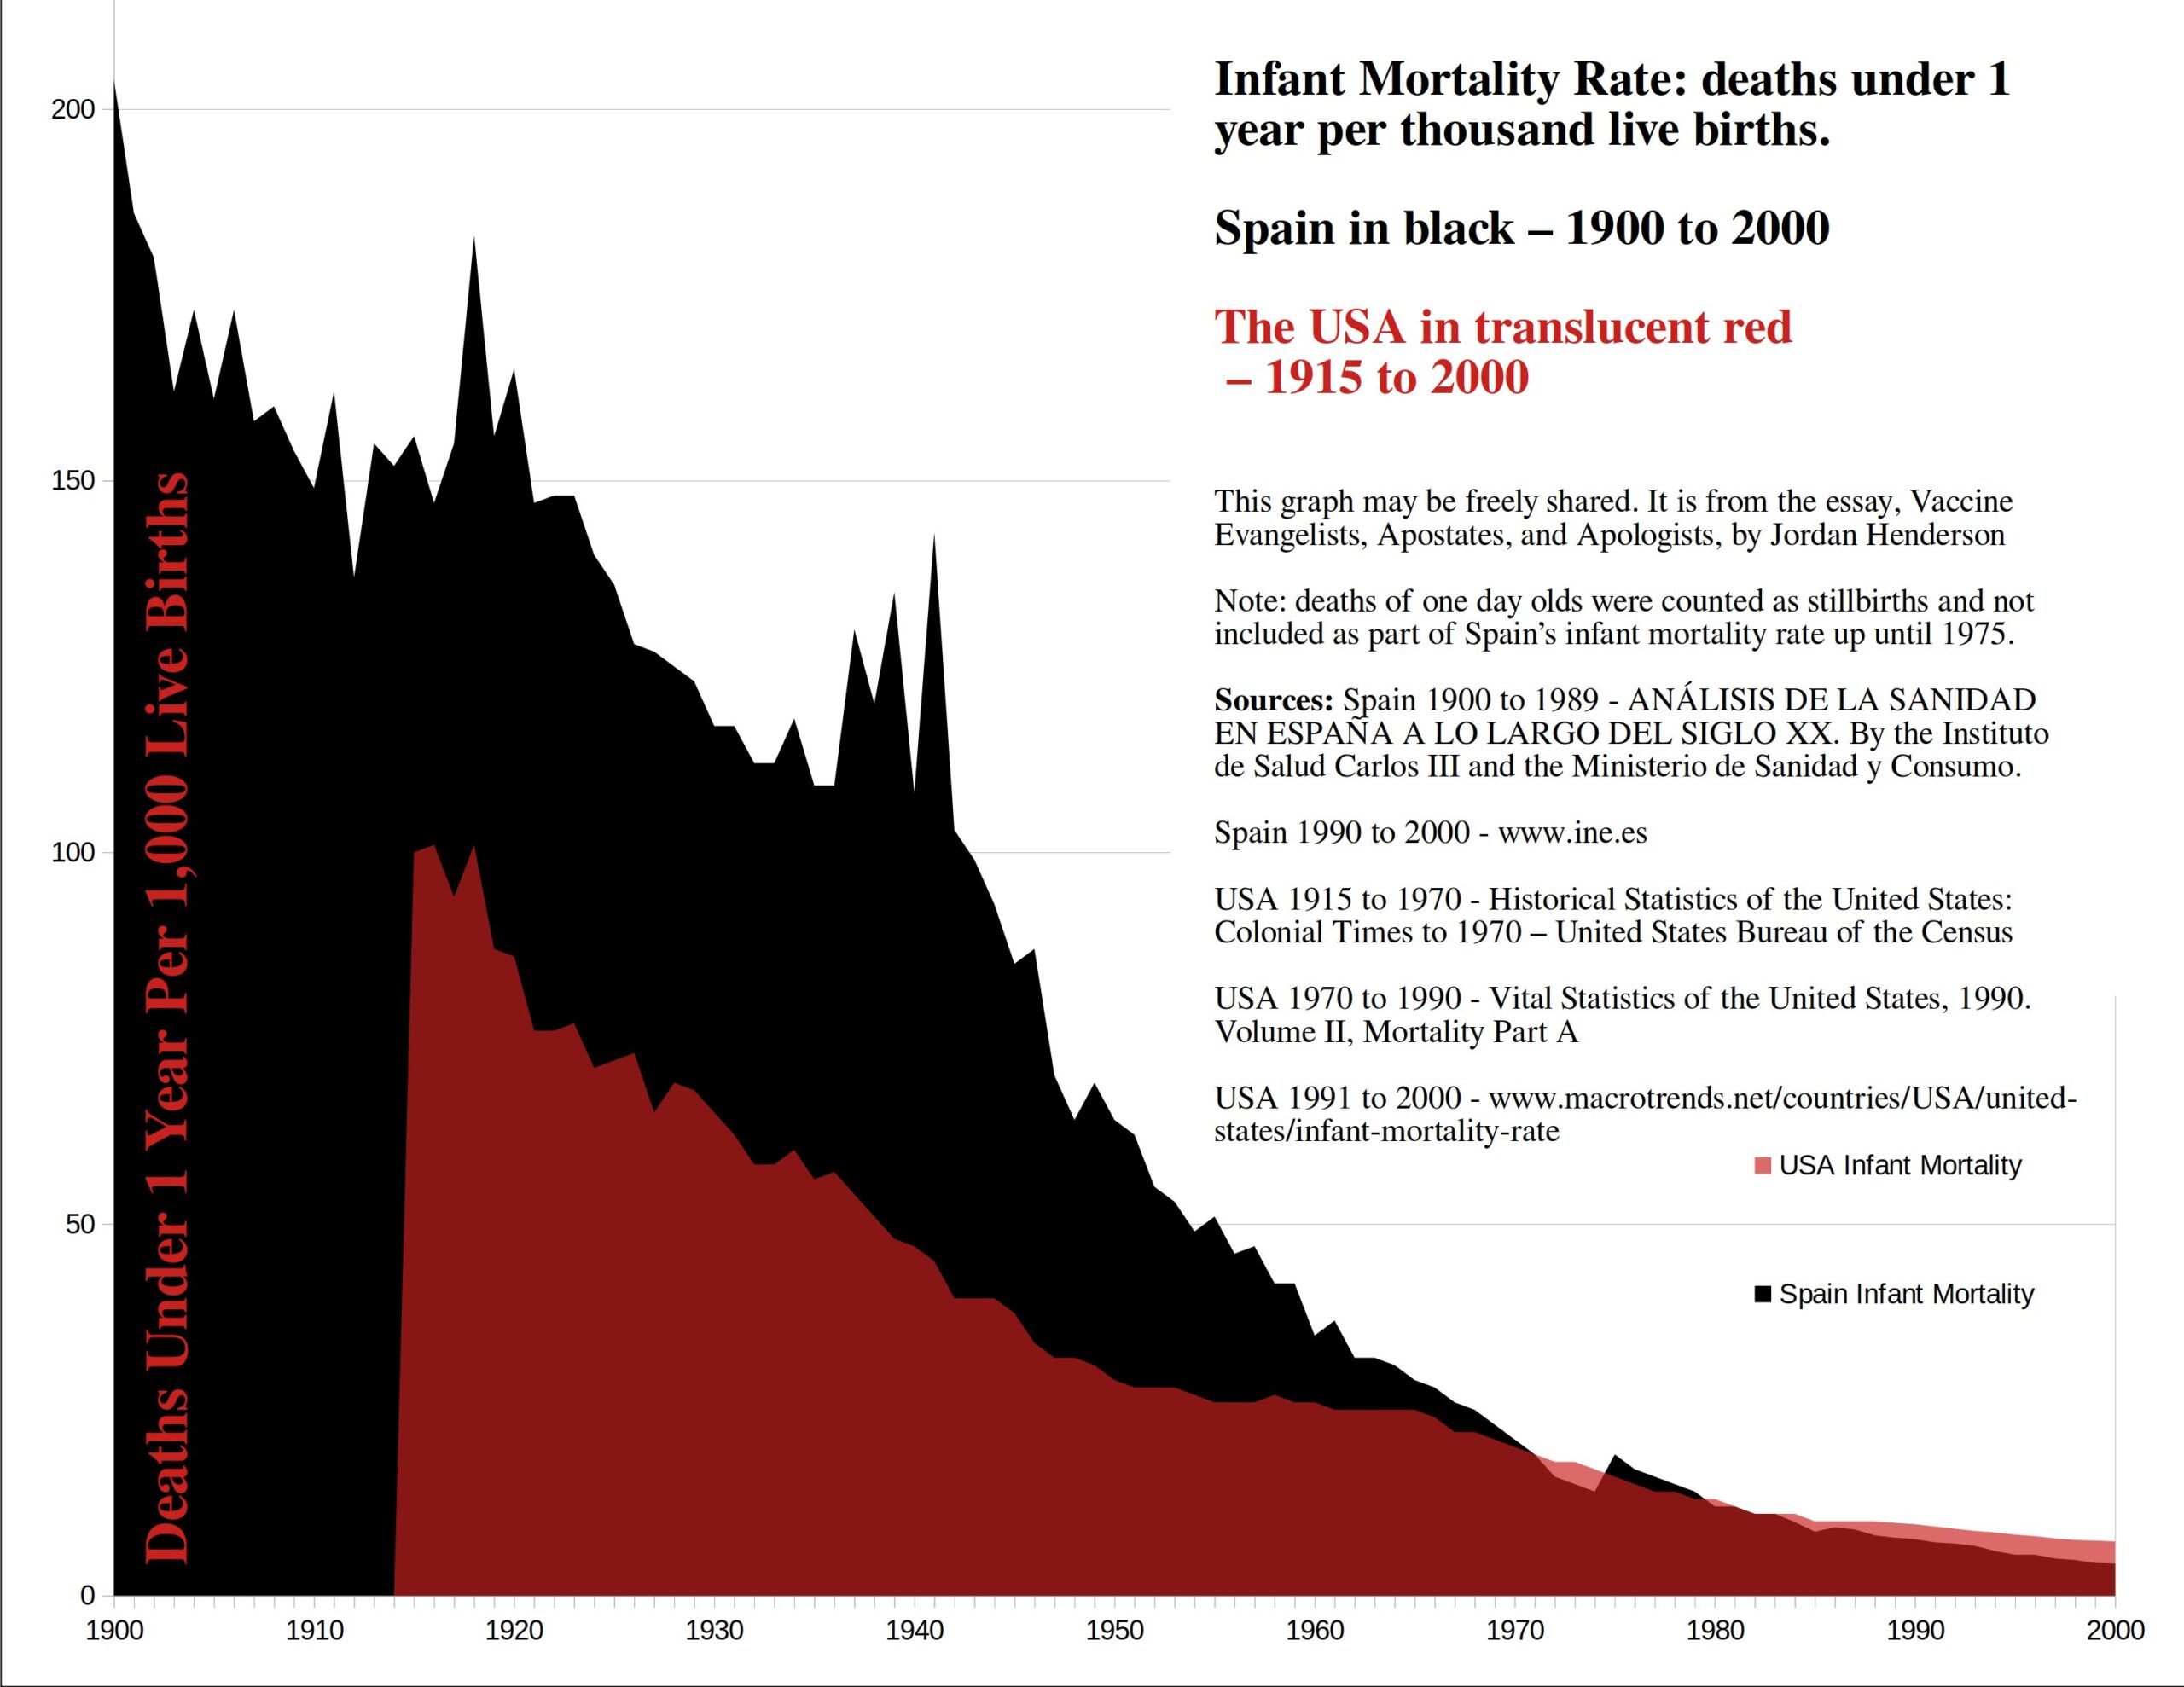
In figure 28, I included the historical infant mortality rate for the United States so as to give us a point of comparison for the Spanish infant mortality data (Though the US birth data isn’t as old because the United States birth registration area wasn’t established till 1915).
We can see that the infant mortality rate was substantially higher in Spain than in the United States in the early and mid-20th century, but also that Spain surpassed the United States and had a notably better/lower infant mortality rate by the end of the 20th century.
The plummet in the 20th century Spanish infant mortality rate is interrupted, and reversed in a major way twice; the first interruption and reversal are concurrent with World War I. I’ve read that despite Spain’s neutrality Spain’s population experienced hardship and a subsistence crisis due to World War I.
The second interruption and reversal of the plummet in the infant mortality rate is during the Spanish Civil War (1936 to 1939) and the years of famines and food shortages following it.
(Also note — that spike in the infant mortality rate for Spain in 1975 is probably not reflective of an actual spike in 1975; the source document mentions that one-day-old deaths had previously not been included in the infant mortality data and had instead been grouped with stillbirths, but were included in the infant mortality beginning in 1975)
Major diseases arranged from most to least deadly in Spain for the first five years of the 20th century
To aid in visualizing the comparative deadliness of each major disease in Spain for the early 20th century, I added up the deaths attributed to each disease during the five years 1900 to 1904, (and 1901 to 1905 for dysentery for which 1900 data was unavailable) and lined them up side by side in the graph below.
Figure 29
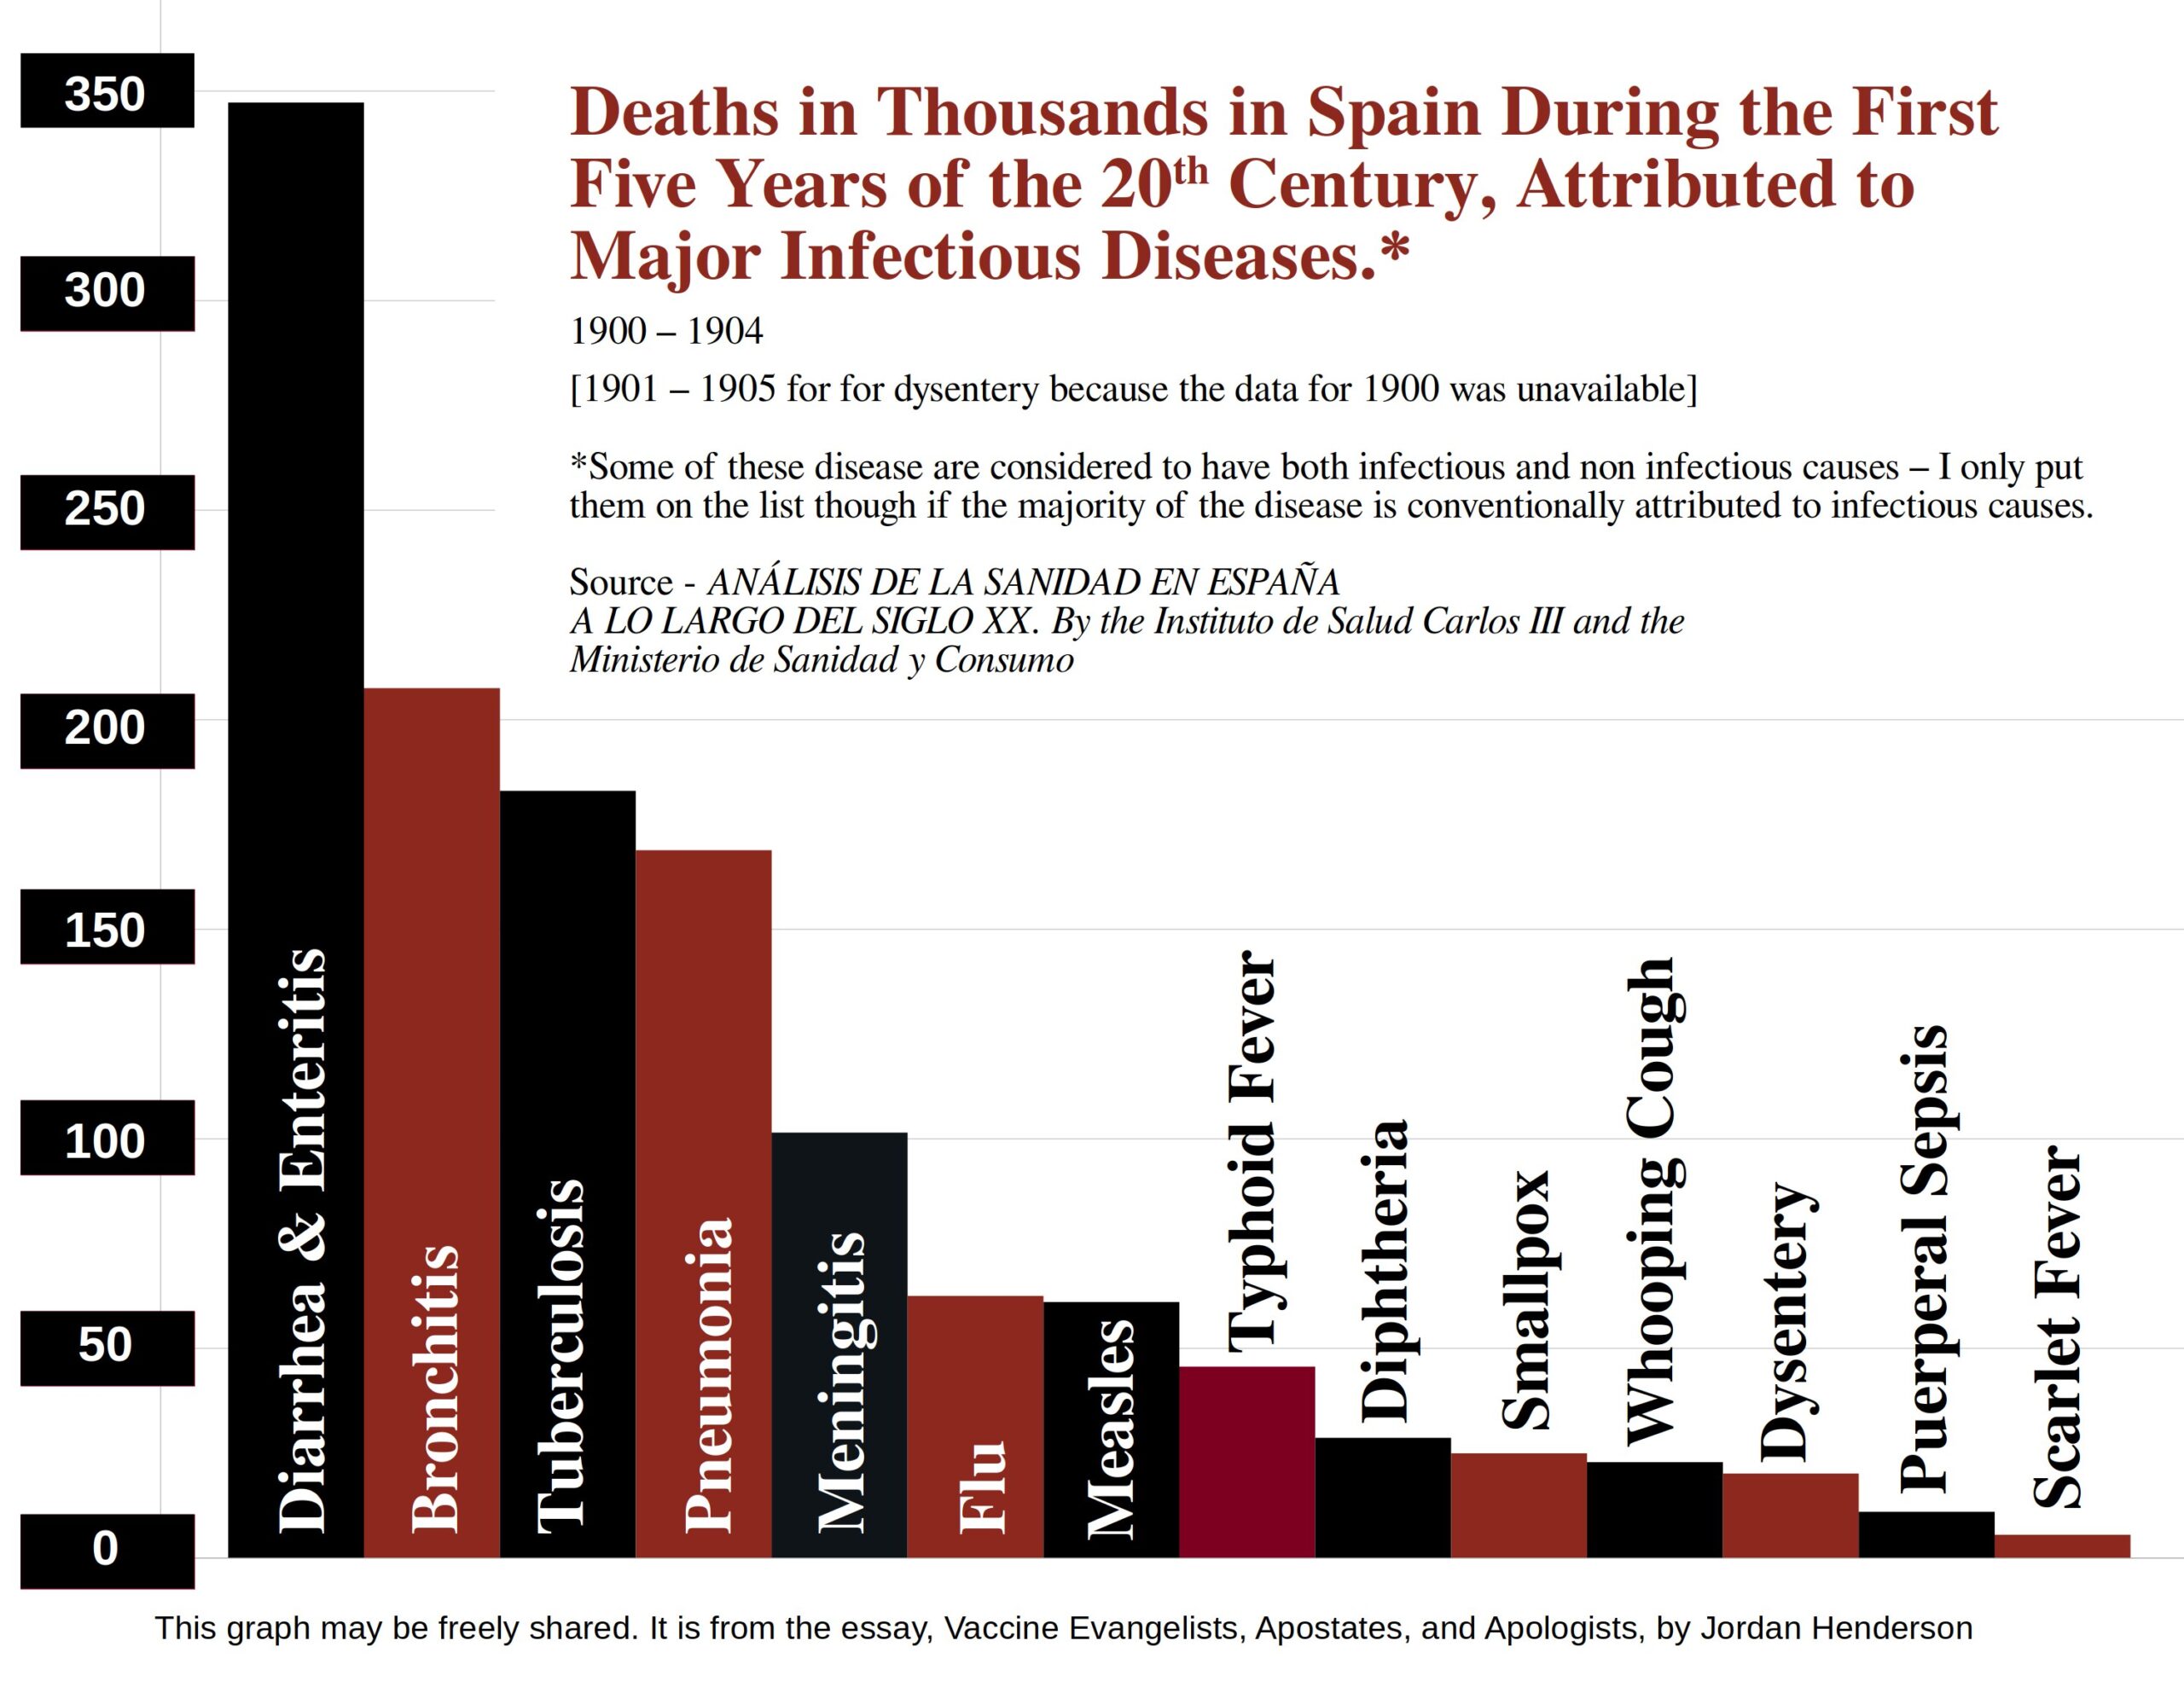
Here we can see in figure 29 the deadliness of the major infectious diseases relative to one another for the first five years of 20th century in Spain. Deaths attributed to diarrheal diseases, tuberculosis, and pneumonia top the list, which are the same three (though in different order) that topped the leading causes of death list for the USA in 1900 (which we reviewed in Part 2: Apostasy). Here, though, we see bronchitis* also at the top, right after diarrheal diseases and before tuberculosis and pneumonia.
~
*Bronchitis is divided into acute bronchitis which is conventionally considered to have an infectious cause, and chronic bronchitis which is generally not considered to have an infectious cause. So preferably only acute bronchitis would be included here, but the only continuous series of data that I could find for bronchitis mortality in 20th century Spain was for both types of bronchitis combined.
However we can see that in early 20th century Spain, for the years 1912 to 1920 over two thirds of the recorded bronchitis deaths are for acute bronchitis. Having a list for only acute bronchitis would move bronchitis down the list of leading causes of infectious diseases deaths, though it would still be near the top; it would probably come right after pneumonia and before meningitis.
~
Let’s now look at the single worst year for each major infectious diseases in the 20th century (please note; I don’t intend to endorse the belief that all these diseases necessarily have infectious origins – I refer to them as infectious diseases simply because that’s what they are conventionally considered and categorized as).
Figure 30
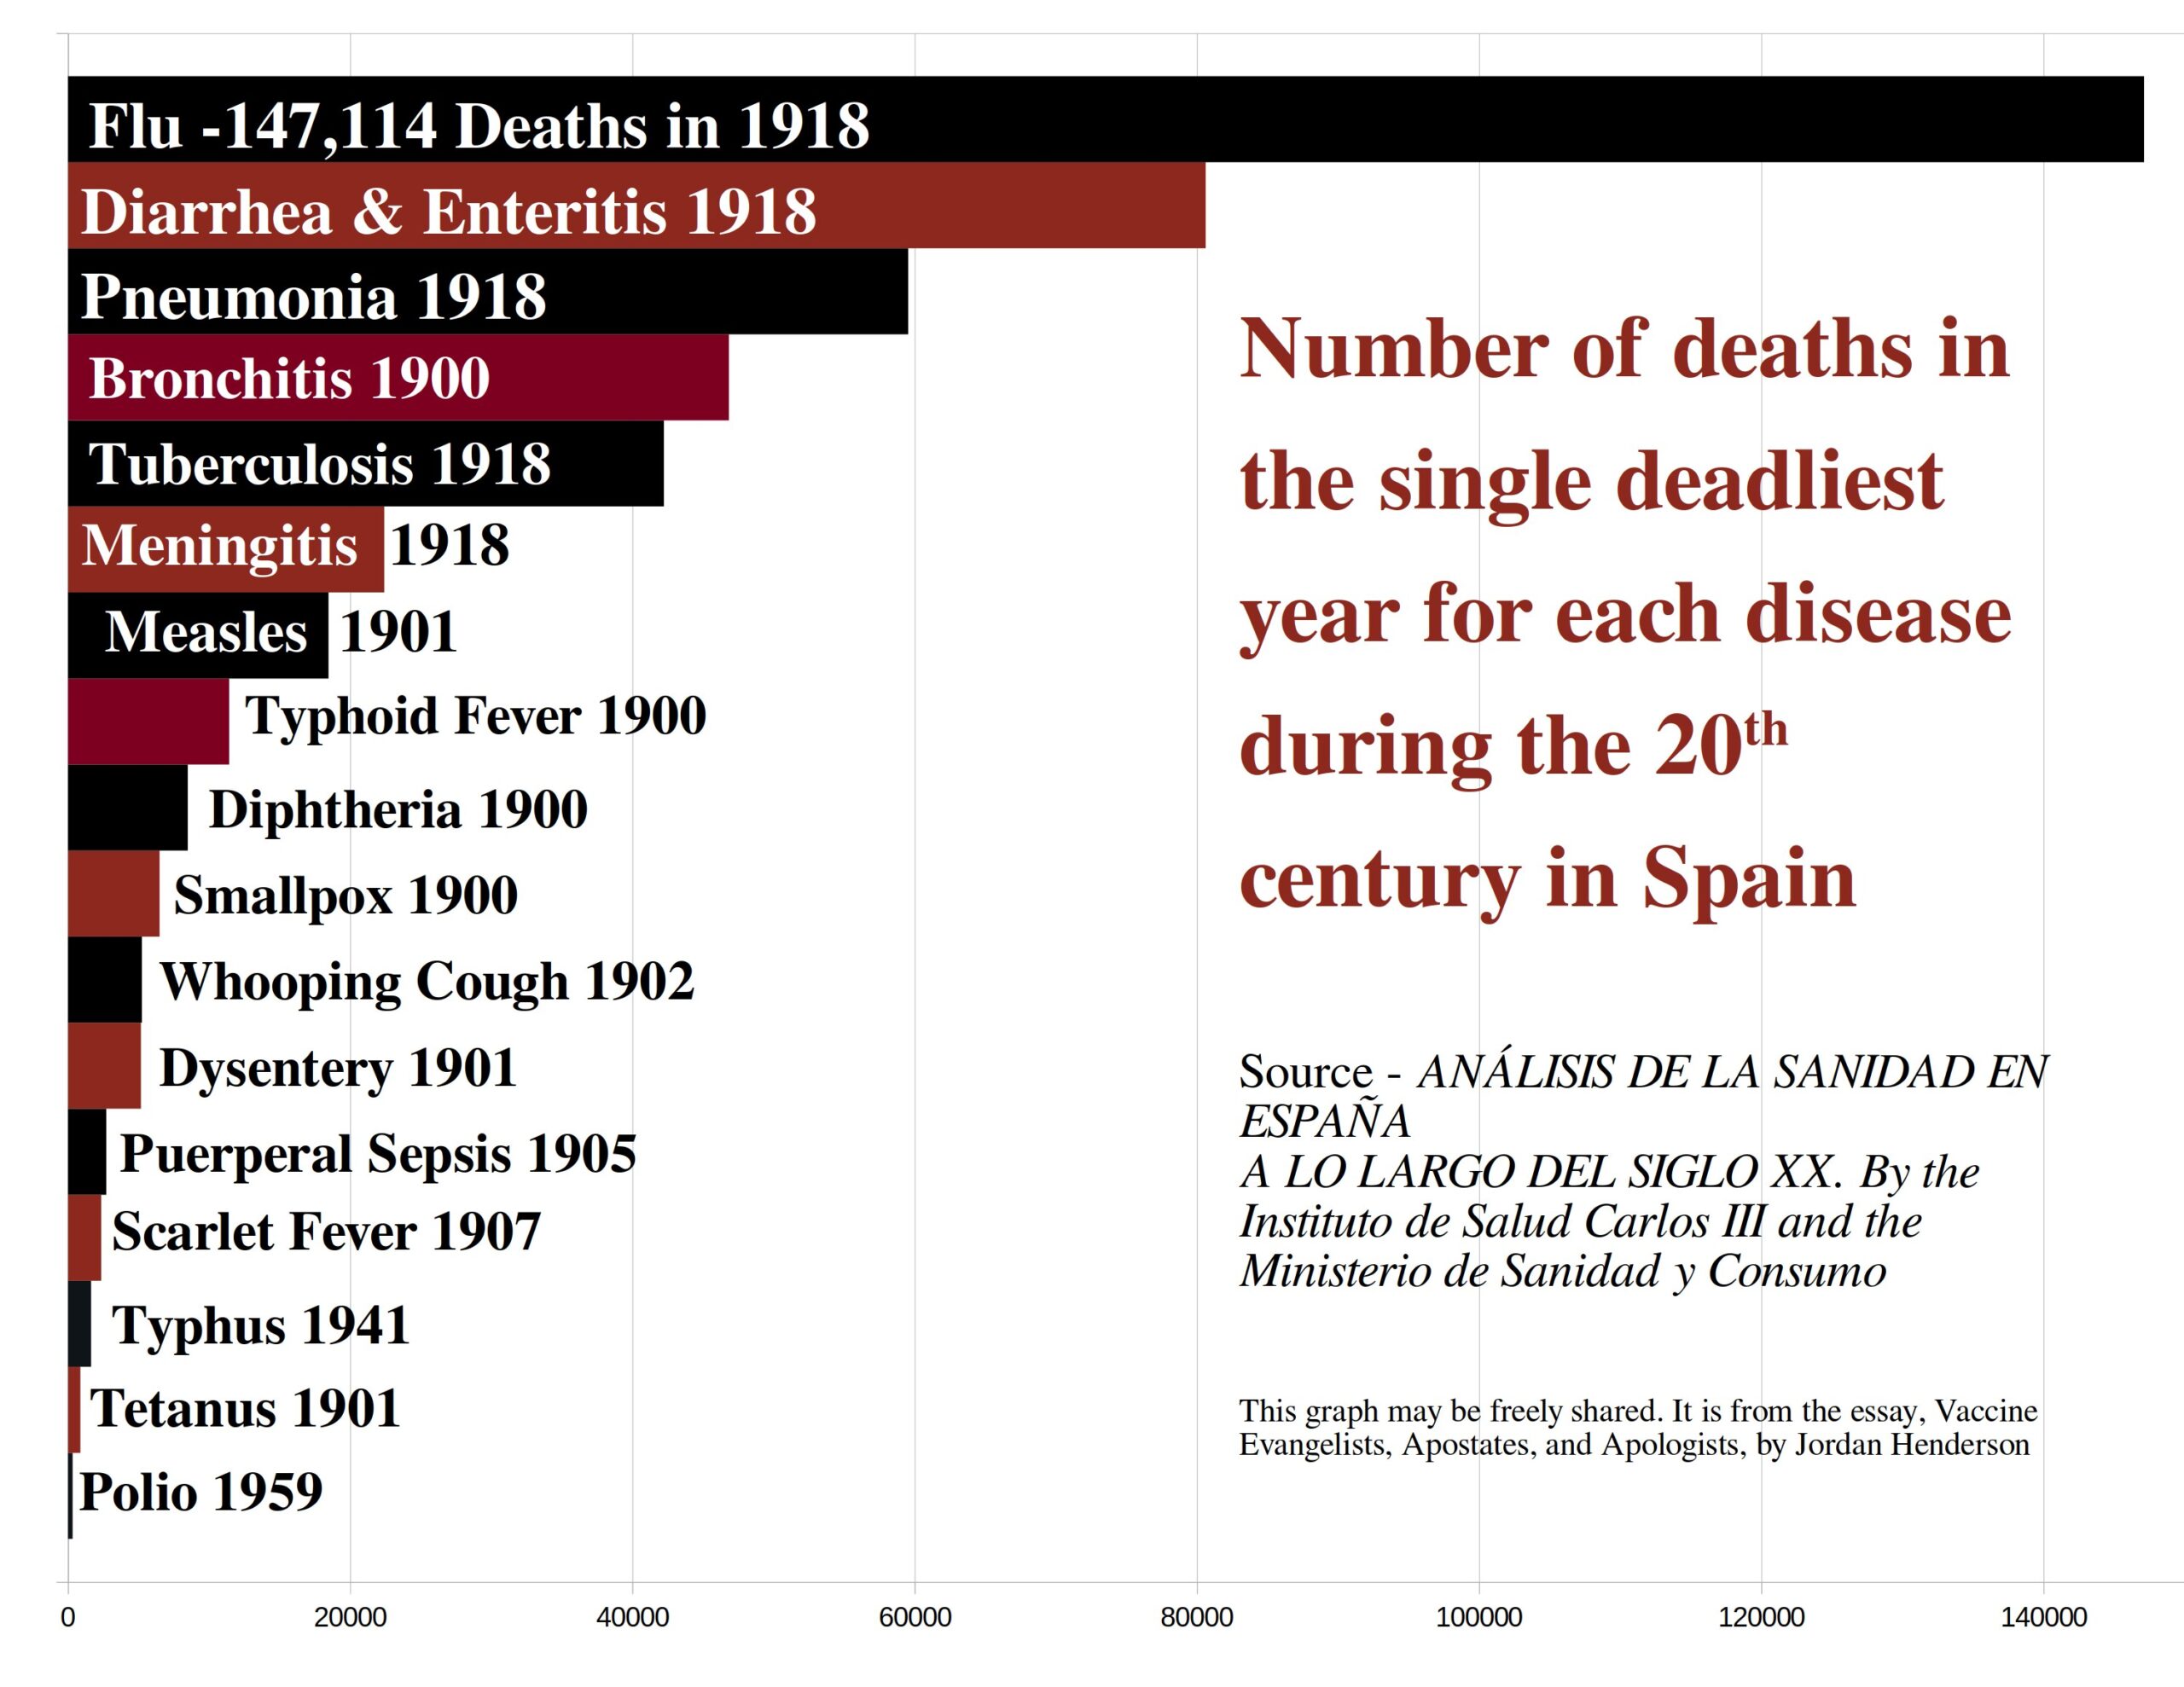
The year 1918, dominates the chart with the deaths attributed to the flu of 1918, but it is also the highest 20th century year for the mortality of four other major infectious diseases in Spain.
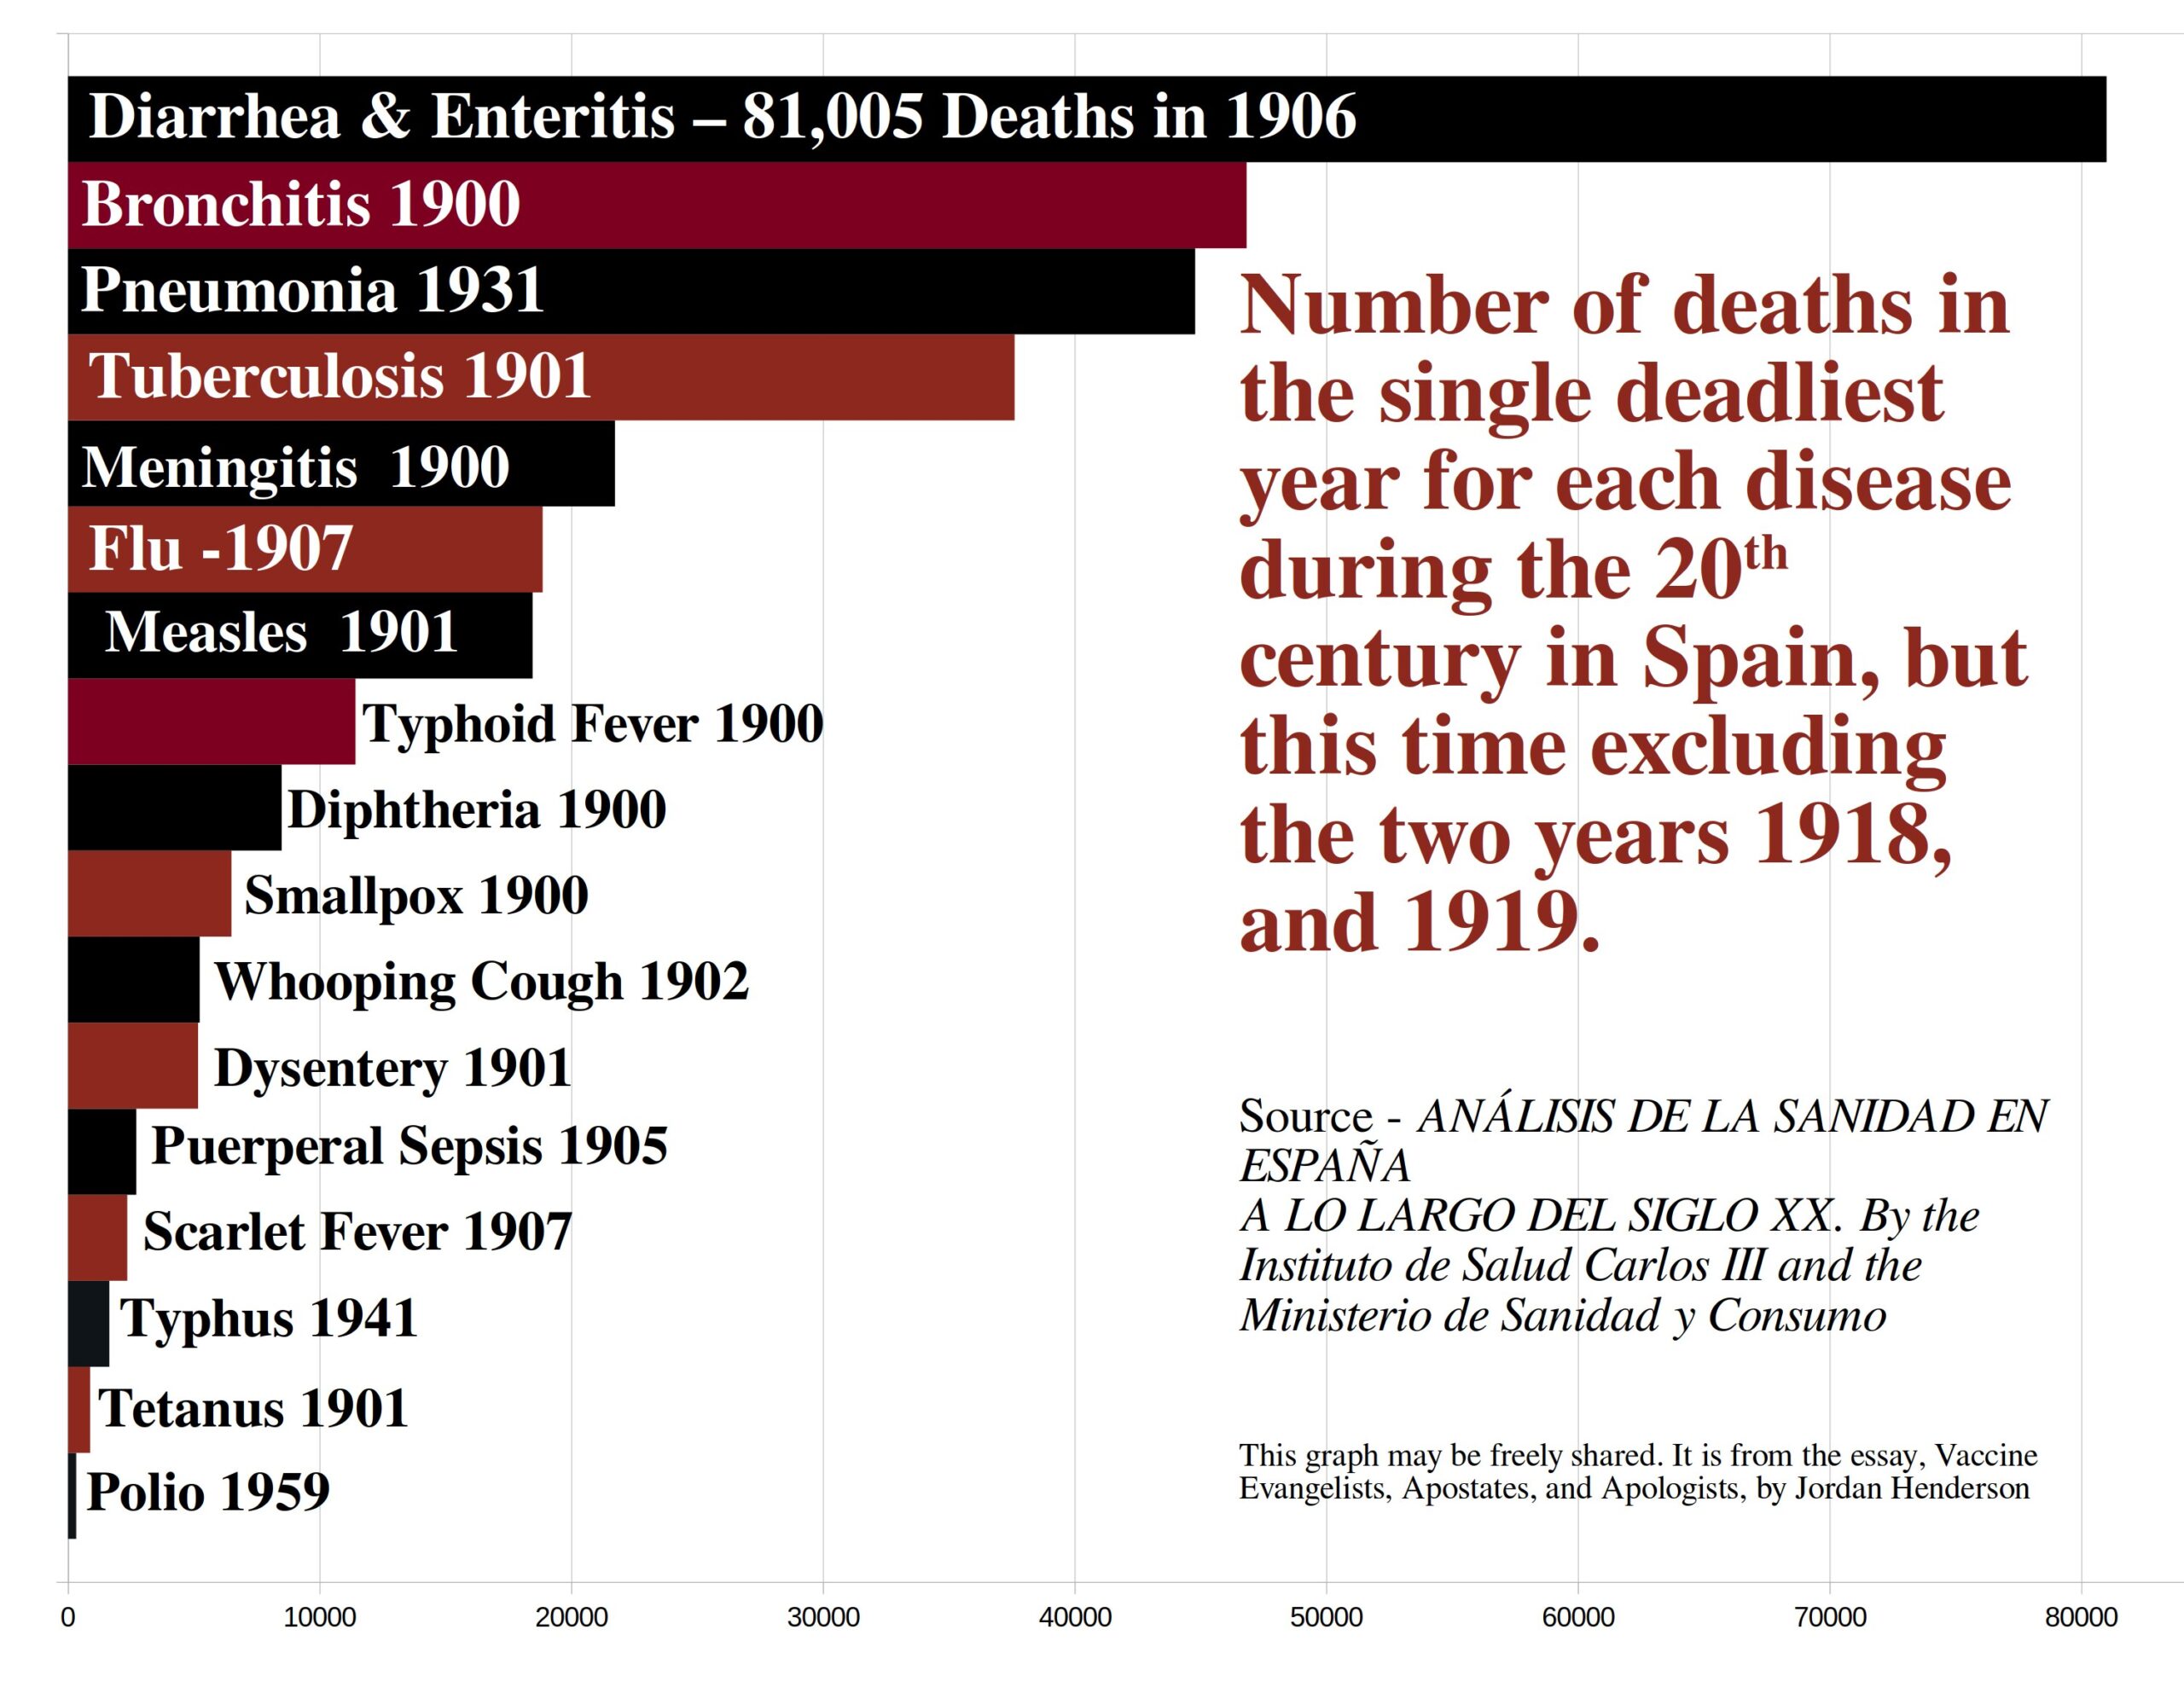
To get a picture of how mortality from these diseases stacks up relative to one another outside of the anomalous years of 1918 and 1919, let’s look at one last comparison; same graph as figure 30 but this time excluding the years 1918 and 1919.
Figure 31
This concludes the overview. After a brief review of some vaccine evangelism in Spain we’ll look at death data attributed to each disease so that we can view the trajectories of mortality from each disease individually in Spain. We won’t hit every single one; specifically, I won’t be going over smallpox or polio which as I noted in Part 2: Apostasy each demand separate at length discussion to the point that they could easily hog the whole essay series if I didn’t intentionally set them to the side.
- Vaccine Evangelism in Spain
In the first installment of this essay series (Part 1: The Evangelists) we reviewed numerous examples of Vaccine Evangelists in the English-speaking world in which Vaccine Evangelists preached messages that promoted the central misconception of the Doctrine of Salvation Through Vaccination.*
Before we look at the mortality profiles of the major infectious diseases in Spain, let’s first immerse ourselves in some Spanish Vaccine Evangelism, and compare the impression that we get from these Vaccine Evangelist messages with the historical mortality data that we are about to look at.
Spanish Vaccine Evangelism is hardly any different than English Vaccine Evangelism, save that, of course, Spain is more often used as the case example for Spanish Vaccine Evangelists.
(* The central misconception of the Doctrine of Salvation Through Vaccination being:
The belief that vaccines played a primary role in causing the drastic decline in deaths attributed to infectious disease in general, and many major diseases in particular, that occurred in the late 19th and early 20th centuries, especially as this relates to the plummet in infant and child mortality rates; and also the corollary belief that, these diseases would return with comparable devastation if we stopped vaccination against them.)
Whooping Cough Mortality and Vaccines in Spain – Exhibits M through P
Here we have a selection of examples in which a specific, iconic disease is being discussed, in this case whooping cough, and in each example the implication is given that vaccines are the primary reason for whooping no longer being a major cause of child mortality in Spain.
The statements that we are about to review are not fabricated lies, they are lies by omission.
In each one of these examples the authors do not inform the reader that more than 98% of the 20th century decline in Spanish whooping cough mortality occurred before whooping cough vaccines were added to the Spanish vaccination schedule in 1965 (as we will see a little later in this essay); they leave you to think that a vaccine was the primary reason for the reduction in whooping cough deaths in Spain.
Exhibit M
“Whooping cough was one of the most common childhood diseases and one of the most important causes of mortality in children before the introduction of vaccination programs in 1965.”
-That’s from the 2009 Situation of Whooping Cough in Spain, by the National Epidemiology Center: Carlos III Health Institute.
Exhibit N
“Pertussis is an acute bacterial infection of the upper respiratory tract caused by Bordetella pertussis. It was one of the most common diseases and one of the most important causes of mortality in children before the introduction of vaccination programs. In Spain it has been a notifiable disease since 1904. The vaccine was included in Aragon’s children’s calendar in 1965.”
From a 2023 article Public Health detects an outbreak of whooping cough in Zaragoza with at least 24 cases from the Spanish newspaper paper Heraldo de Aragón.
Exhibit O
“Whooping cough was one of the most common childhood diseases in Spain and one of the most important causes of mortality until the introduction of systematic vaccination in 1965 against Bordetella pertussis, the bacterium that causes the infection.”
Whooping Cough is not Child’s Play article in – a 2014 article in El Mundo – a large newspaper in Spain.
Exhibit P
“In Spain, following the introduction of the whooping cough vaccine in 1965, mortality was reduced until the decade of the 90s, deaths from whooping cough were barely reported; going from approximately 130 deaths annually before the introduction of vaccination to 4 deaths annually in recent seasons.”
That’s from the 2020 – Study of Seroprevalence in Spain, page 110, by the Spanish government’s Ministry of Health.
Child Mortality in Spain + a Lifespan Lecture – Exhibits Q through T.
Here we have three examples which give the reader the idea that vaccines are the main reason for infectious disease no longer being the main cause of infant mortality in Spain and developed countries in general (exhibits Q, R and S respectively), followed by a Lifespan Lecture in which vaccines are credited for nearly forty years of increased longevity (exhibit T).
Exhibit Q
“Before the introduction of vaccination schedules in Spain, infectious diseases were the main cause of infant mortality (Table 1) and epidemics were frequent.”
That’s from Important Reasons to Vaccinate Children which is the title of a four-page vaccine promotional by the Spanish government’s health ministry.
They back up this assertion with two infographics; a polio notification of incident graph and a table that shows you the number of deaths for one year for selected diseases during a time before vaccination for that disease in Spain, and then they show you the number of deaths for each disease in 2008. Evidently we are supposed to assume that the difference is attributable to the vaccines, and that vaccines are the reason for infectious disease no longer being the main cause of infant mortality.
Exhibit R
“Before the introduction of vaccination schedules in Spain, infectious diseases were the main cause of infant mortality and epidemics were frequent.”
That excerpt is from a 2015 Europress article concerning HPV vaccine coverage in Spain with a section on vaccines in general. This was also reported by Redacción Médica, and there they list the Spanish government body, the Council of Ministers as the source.
The only attempt they make in this article to defend their implication that vaccines are to thank for infectious diseases no longer being the main cause of infant mortality is this paragraph which immediately follows the excerpt above:
“As an example, the year of maximum incidence of pertussis occurred in 1985 with 60,564 cases, in 2010 cases dropped 722; diphtheria cases had their highest incidence in 1940 with 27,517 cases registered; in 1983 there were more than 301,319 cases of measles and more than 161,772 cases of rubella, in 2010 there were 274 cases of measles, while only 10 cases of rubella were counted.”
How does that prove their point? The pertussis example is especially counterproductive to the point that they are trying to make; the year of maximum incidence they give as 1985. 1985 is 20 years after widespread pertussis vaccination in Spain.
Exhibit S
“Prior to the introduction of vaccination schedules in developed countries, infectious diseases were the leading cause of infant mortality (tetanus, polio, diphtheria, pertussis, measles, measles). rubella, parotitis) and epidemics were frequent.”
That’s from the 2018 article Reasons to Vaccinate Children, written by a pediatrician, for the Spanish magazine Guía Infantil.
Exhibit T
“The reality is that people can afford to be anti-vaccine because vaccines have been very successful. A century ago, life expectancy in Europe was 47 years. People died of diphtheria, tetanus, smallpox and cholera.”
“Anti-vaccinationists exist because, thanks to vaccines, they have never seen these diseases. Our life expectancy is 85 years and they take it for granted, but if we live 40 more years it is because we have conquered these microorganisms.”
“This is one of the greatest conquests that human beings have ever made. We are the luckiest generation ever on this planet, the first in three million years to have the luxury of living 85 years. We have failed to communicate and educate about this conquest. Young people should be aware that these microorganisms are not gone, save for small smallpox, and if we stop vaccinating, they will return. We can go back and live again for 47 years.”
These excerpts in Exhibit T are from a 2017 article Opponents of vaccines have forgotten that before vaccines we lived 47 years which is the title of an interview with Rino Rappuoli, published in the Spanish digital newspaper El Confidencial.
This is of course yet another example of the Vaccine Evangelists’ Lifespan Lectures, such as those we reviewed in the first essay installment of this series (Exhibits I through L).
Rino Rappuoli is a prominent vaccine developer. Here are just the first two paragraphs of his biography on the Royal Society to give you an idea of his accomplished career developing vaccines:
“Rino Rappuoli is Chief Scientist and Head External R&D, GSK Vaccines. A PhD in Biological Sciences he has served as visiting scientist at Rockefeller University and Harvard Medical School. His past roles comprise Head R&D, Sclavo, Head Vaccine Research and CSO, Chiron Corporation, and Global Head R&D, Novartis Vaccines.
Major achievements include development of CRM197 used in H.influenzae, N.meningitidis, and pneumococcus vaccines; an acellular pertussis vaccine containing a genetically detoxified pertussis toxin; the first conjugate vaccines against meningococcus; MF59 adjuvant for influenza; the meningococcus B genome-derived vaccine.”
- Graphical profile of 20th century mortality in Spain for individual diseases, and their respective vaccines or lack thereof
Let’s now view the trajectories of mortality from each major and iconic infectious disease in Spain beginning with the deadliest.
The leading cause of death in the infectious disease category in early 20th century Spain was diarrhea and enteritis (enteritis is inflammation of the small intestine; can have multiple causes but is commonly attributed to pathogens) so we’ll start our review there.
Diarrhea and Enteritis
Figure 32
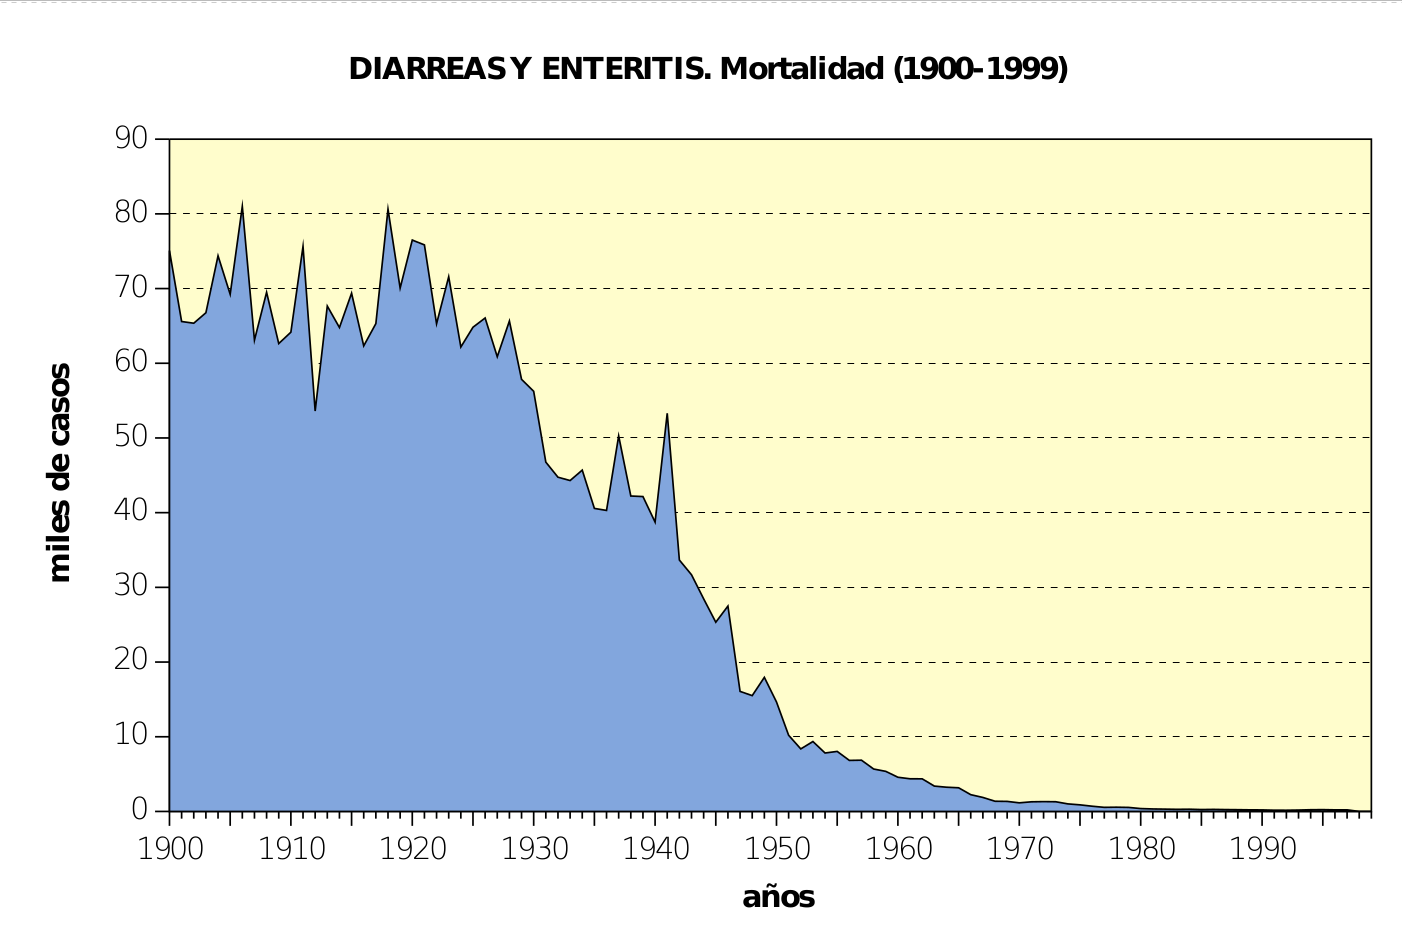
Figure 32 is a screenshot from page 108 of ANÁLISIS DE LA SANIDAD EN ESPAÑA A LO LARGO DEL SIGLO XX.
Here we are looking at the single biggest category of infectious disease death for 20th century Spain and there are no vaccines to speak of for it during this time.
According to the authors of Analysis of Health in Spain Across the 20th Century, of the 75,000 diarrheal deaths in Spain in the year 1900, 40,000 of those deaths were in children under the age of two.
Notice how the mortality profile of this disease category is very similar to the overall profile for infant mortality in Spain (Figure 28).
Tuberculosis
The chart below is the pulmonary and non-pulmonary tuberculosis deaths expressed as a rate per hundred thousand, and the BCG vaccine (the vaccine for tuberculosis) doses per year in millions, using the tables from ANÁLISIS DE LA SANIDAD EN ESPAÑA A LO LARGO DEL SIGLO XX.
Figure 33
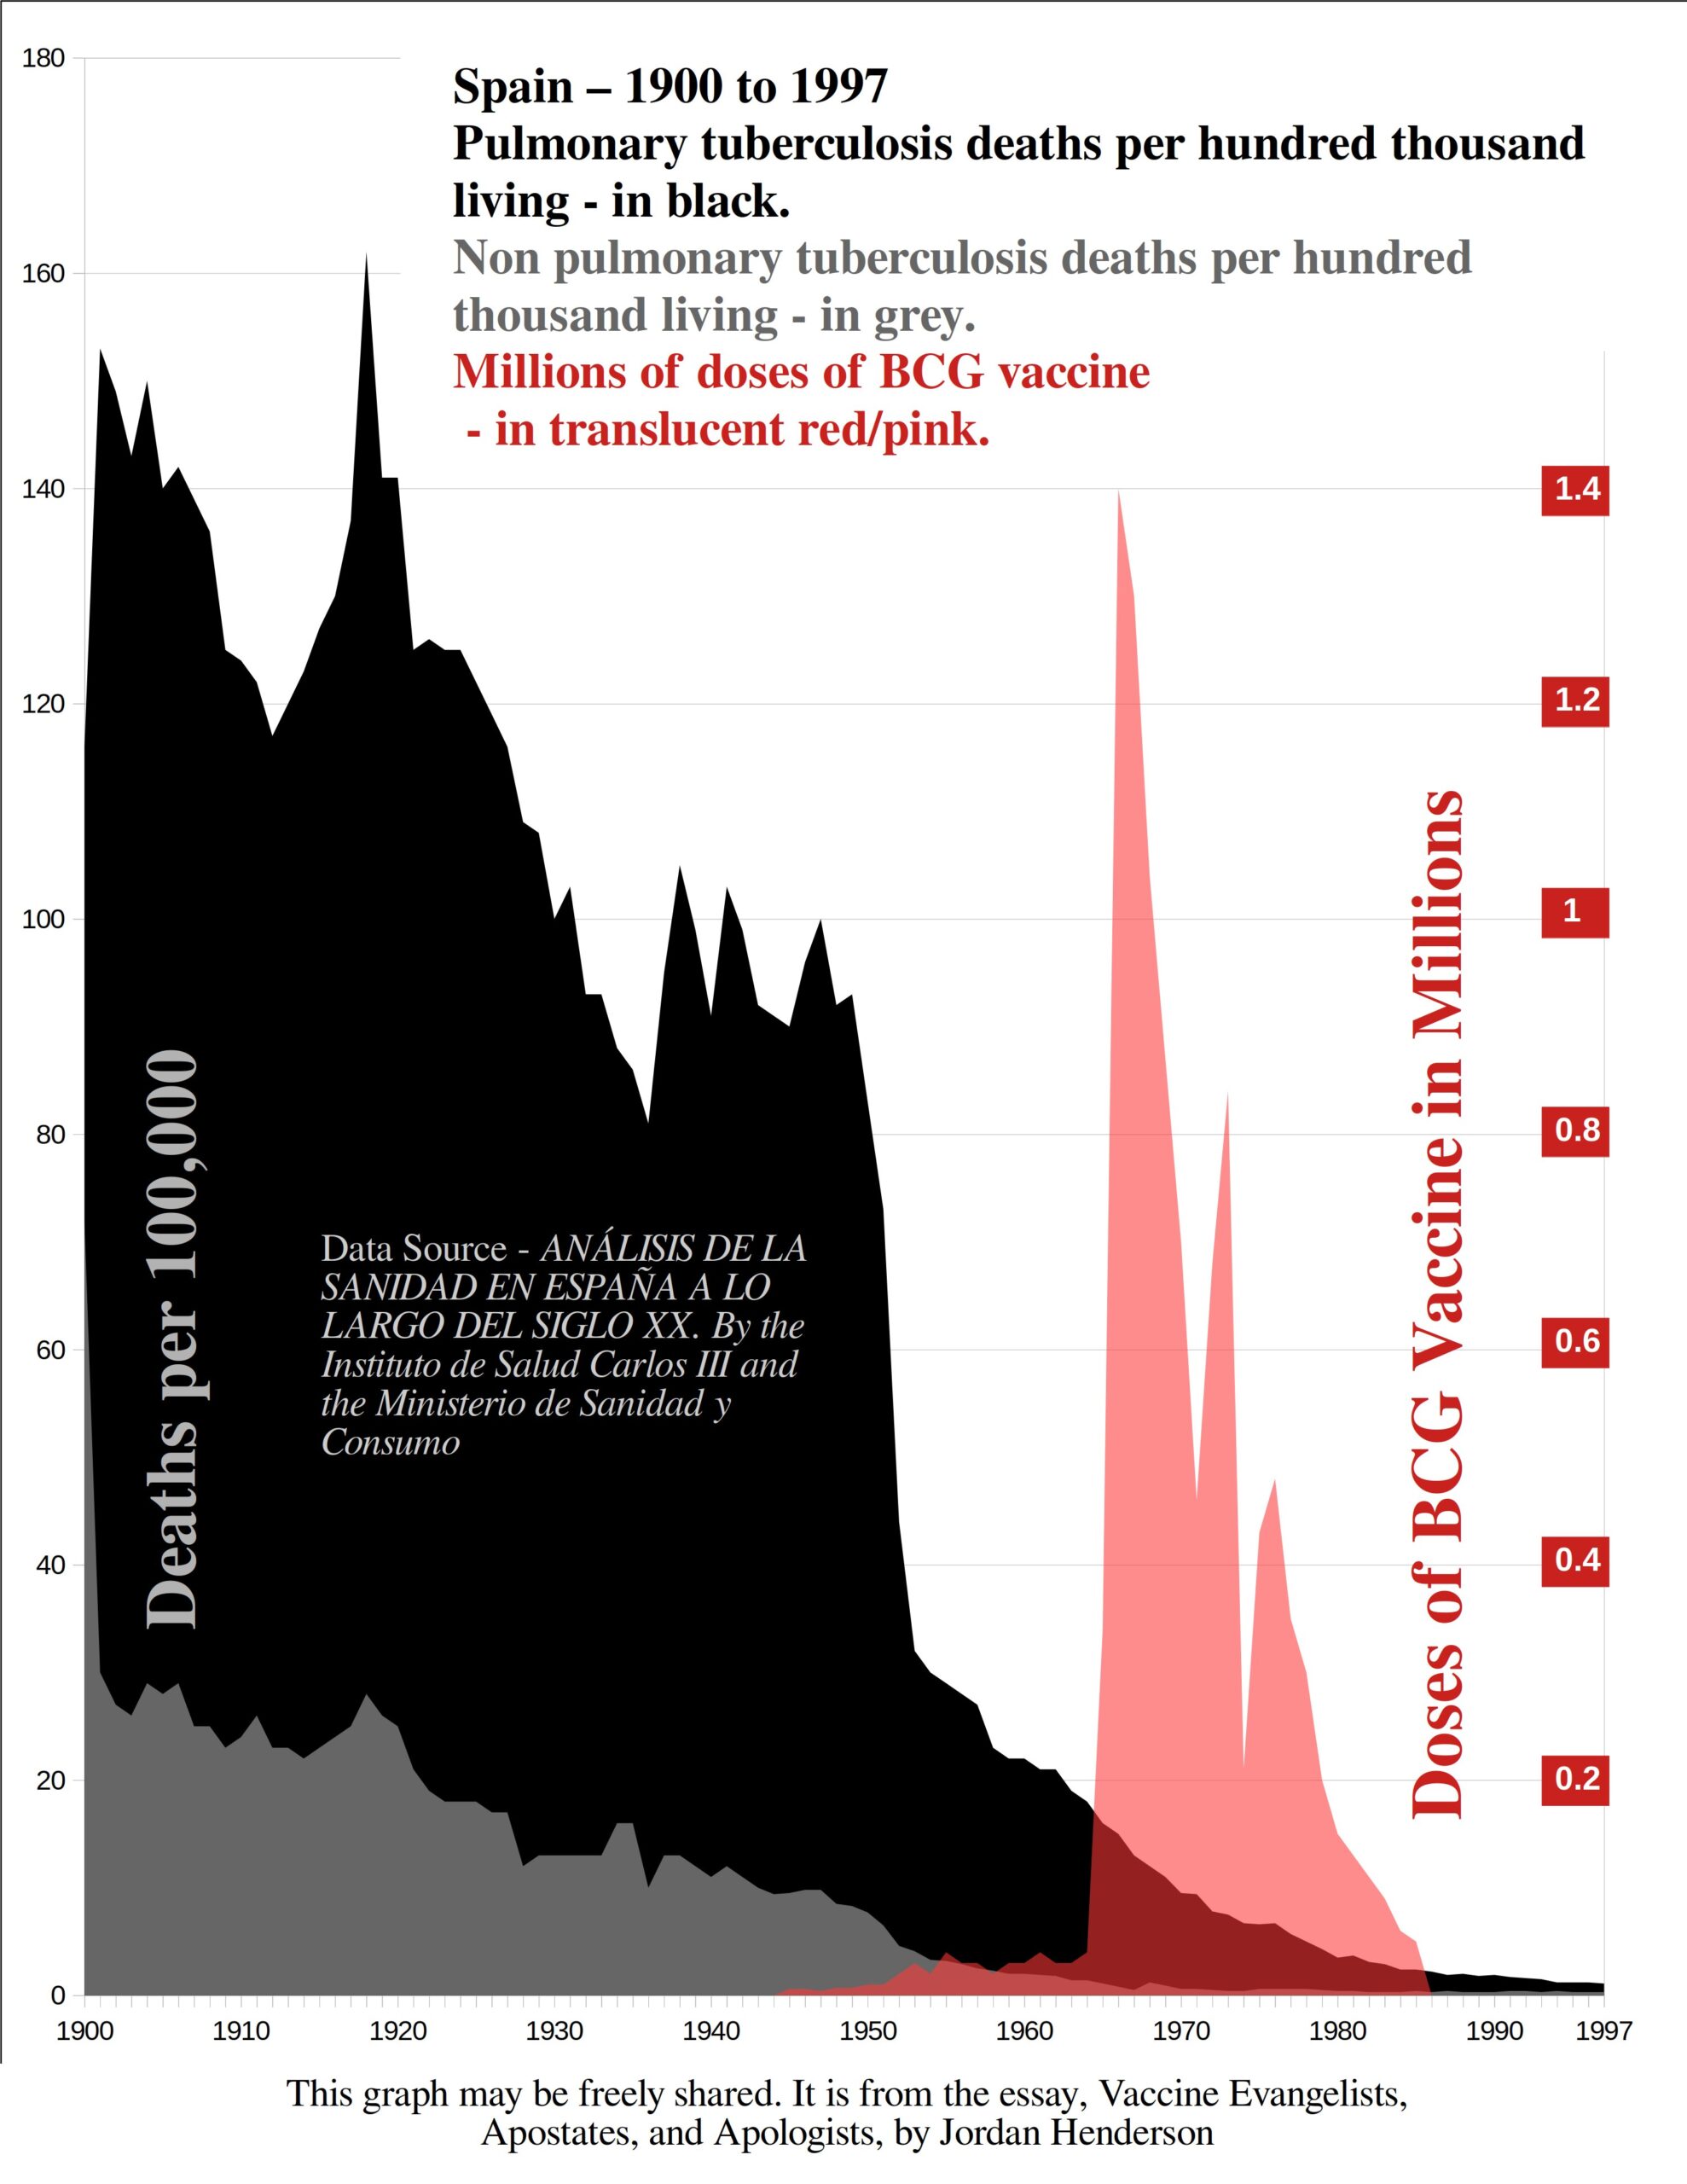
The data for this graph you can find on pages 226, 227, 237, and 238 of ANÁLISIS DE LA SANIDAD EN ESPAÑA A LO LARGO DEL SIGLO XX.
We can see the plummet in tuberculosis mortality is reversed during the years leading up to and after World War I, which is similar to what we saw in the infant mortality graph (Figure 28), and the trend is reversed again during and after the Spanish Civil War, which is also similar to what we saw in the infant mortality graph. Interesting as here in the tuberculosis death rate we are primarily looking at mortality in adults.
The author’s of ANÁLISIS DE LA SANIDAD EN ESPAÑA A LO LARGO DEL SIGLO XX attribute the near sheer drop in pulmonary tuberculosis deaths beginning in 1950 to several drugs developed in the late 1940s and early 1950s. I wouldn’t buy that explanation without first applying careful scrutiny to the claim, but I’m also not willing to part with the potentially considerable amount of time and energy that might be necessary to evaluate that claim, so I’ll leave it be for the time being.
What we can definitively see from this graph is what did not cause the dramatic 20th century decline in pulmonary and non-pulmonary tuberculosis deaths in Spain; vaccines did not cause the decline; vaccines can logically be ruled out.
The recorded vaccinations before 1965 amount to very little coverage for a nation the size of Spain and most of the decline in pulmonary and non-pulmonary tuberculosis deaths occurs before BCG vaccines are administered in great numbers in the late 1960s. Spain abandoned routine immunization of infants with BCG vaccines in the ’70s and ’80s.
Notes for Figure 33:
- Whether tuberculosis or pneumonia should have come second in our review is really a tossup because while more deaths were being attributed to tuberculosis than to pneumonia during the first five years of the 20th century in Spain as we saw in figure 29, we could also see that the worst years for pneumonia surpassed the worst years for tuberculosis (as seen in figures 30 and 31). I went ahead and ranked tuberculosis second based on it’s slightly greater prominence over pneumonia as a cause death in early 20th century Spain.
Bronchitis for the reasons given earlier should really probably come fourth, after tuberculosis and pneumonia but before meningitis.
- Pulmonary and non-pulmonary tuberculosis was associated with mortality in both adults and children but more so in adults than in children. You can see the age distribution of tuberculosis deaths by going to the older statistical yearbooks of Spain where they have the number of deaths broken down by cause of death and age of the deceased; here is a PDF of the oldest relevant one I could find on www.ine.es – 1905, and here is a PDF for the next year 1906.
As we discussed in the first section of this essay installment, the overall population for Spain doubled in the 20th century, even though the yearly number of live births remained remarkably steady until after the 1970s. So for diseases such as tuberculosis that are associated with deaths in adults as much or more so than children, we will get a more accurate picture by looking at the death rate per 100,000 rather than the raw unadjusted number.
Pneumonia
By consulting the same early 20th century records for Spain showing the breakdown of deaths by age group (1905 Here, 1906 Here) we can see that pneumonia deaths were recorded most heavily at both ends of the age spectrum in the over 60 and under 5 categories. So, to get a clear idea of the mortality trend across the 20th century we will want to again look at the death rate per hundred thousand living, so as to account for the doubling of Spain’s population during this time.
Figure 34
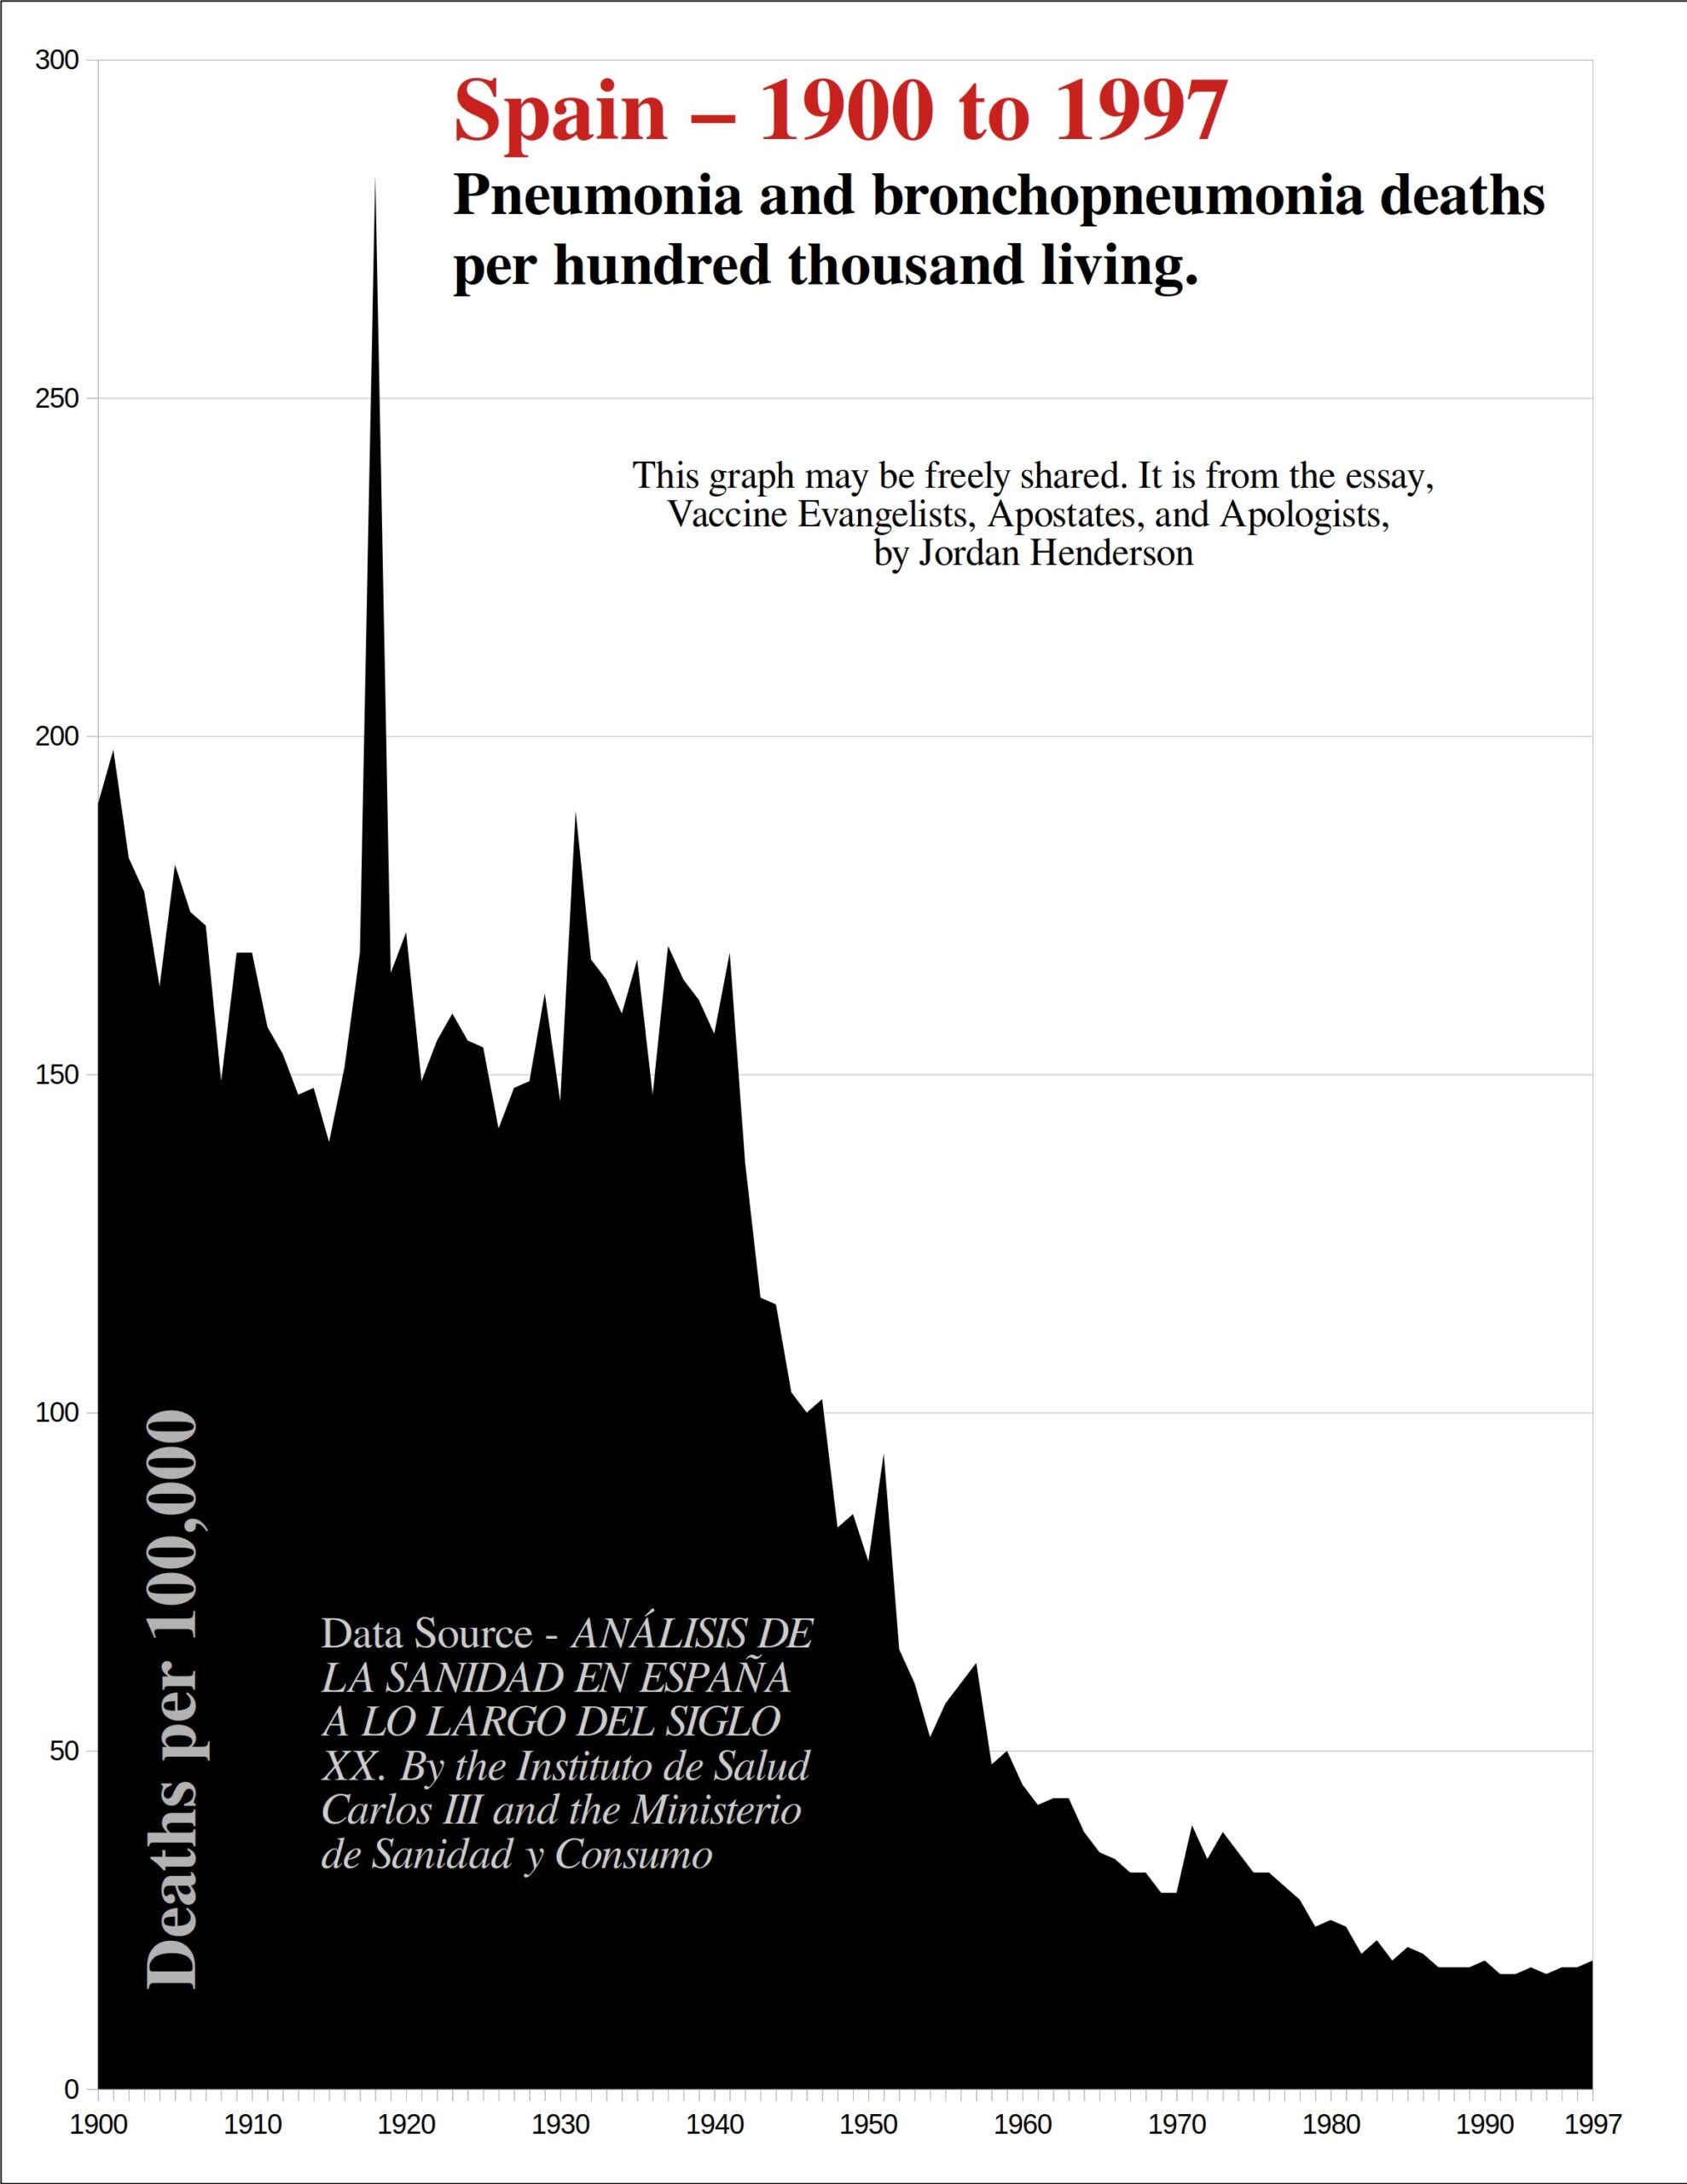
The data table I used for this graph can be found on page 295 of ANÁLISIS DE LA SANIDAD EN ESPAÑA A LO LARGO DEL SIGLO XX.
The source document makes no claims about vaccines causing this drastic decline in pneumonia deaths. They do claim antibiotics were responsible for this decline. Why we should attribute the decline to antibiotics rather than to the end of wartime and postwar conditions they of course do not explain.
I can neither find anyone claiming that this steep drop in pneumonia deaths in Spain was due to vaccines, nor can I find evidence of relevant vaccines being administered widely in Spain during this time.* We can add this to the list of major infectious disease causes of mortality in 20th century Spain for which the steep mortality decline cannot be attributed to vaccines.
*It looks like conjugate pneumococcal vaccines came into widespread use for adults and children in Spain in the 2000s. The Hib vaccine was authorized in Spain in 1994 and introduced to the vaccination schedule in Spain in 1998.
Bronchitis
Figure 35
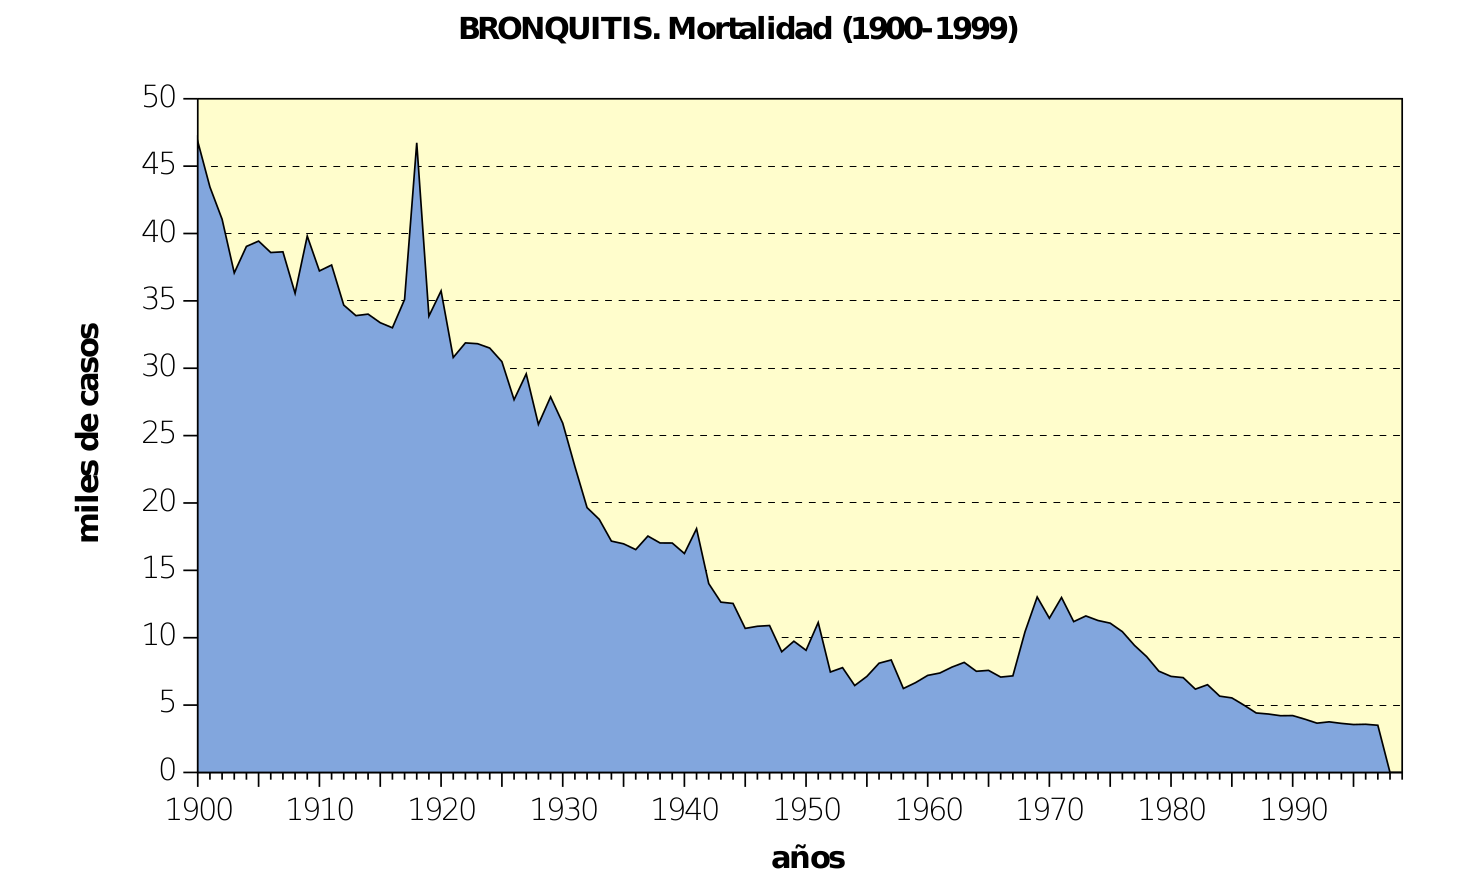
Figure 35 is a screenshot from page 262 of ANÁLISIS DE LA SANIDAD EN ESPAÑA
A LO LARGO DEL SIGLO XX.
We can see that Spanish bronchitis mortality plummeted in the first half of the 20th century. I can find neither evidence of relevant vaccines being widely used during this time period, nor can I find claims that vaccines played a role in this decline. This is yet another major plummet in infectious disease mortality for which vaccines are out of the picture to the point that even the vaccinationists aren’t trying to give credit for this decline here to vaccines.
Notes for Figure 35
- As mentioned earlier in this essay – bronchitis is divided into acute bronchitis which is conventionally considered to have an infectious cause, and chronic bronchitis which is generally not considered to have an infectious cause. So preferably only acute bronchitis would be included here, but the only continuous series of data that I could find for bronchitis mortality in 20th century Spain was for both types of bronchitis combined.
However we can see that in early 20th century Spain, for the years 1912 to 1920 over two thirds of the recorded bronchitis deaths are for acute bronchitis, so this category is primarily comprised of acute bronchitis which is what we want to look at.
- In the breakdown of bronchitis deaths by age groups (1905 Here, 1906 Here) we can see that the most all of the acute bronchitis deaths were in the infant and under five categories. Chronic bronchitis deaths conversely were mostly in the over 60 categories.
As mentioned in the first section of this essay installment, for diseases which primarily affected the very young the actual number of deaths will give us a clearer picture than the death rate per 100,000 (because the yearly number of live births remained remarkably steady in Spain from 1900 to 1980).
So for bronchitis the raw unadjusted number of deaths instead of the rate I judged best since acute bronchitis accounted for over two thirds of the bronchitis deaths in early 20th century Spain and almost all the acute bronchitis deaths where in young children.
- I think that this Spanish bronchitis data set is good enough to see that bronchitis mortality plummeted mid 20th century, but other than that this bronchitis mortality data is a pretty abysmal data set: according to Analysis of Health in Spain Across the 20th Century (page 261) Spain used to have separate categories for acute and chronic bronchitis, but then they lumped them together after 1931, and then in 1965 they threw asthma and emphysema into this category too.
Meningitis
This inflammation of the protective membranes covering the brain and spinal cord, the meninges, is most often attributed to viruses and bacteria. By far the largest meningitis category in the Spanish mortality data is simple meningitis, which is the category for meningitis that hasn’t been categorized as some more specific form of meningitis (the next biggest meningitis category in the Spanish data is tubercular meningitis, which I can’t provide a graph of because I cannot find the tubercular meningitis mortality data past the first few decades of the 20th century).
Most all the deaths in this category in the early 20th century show up in the infant, 1 to 4, and 5 to 9, year old age groups. So then let’s look at the unadjusted actual number of yearly recorded deaths.
Figure 36
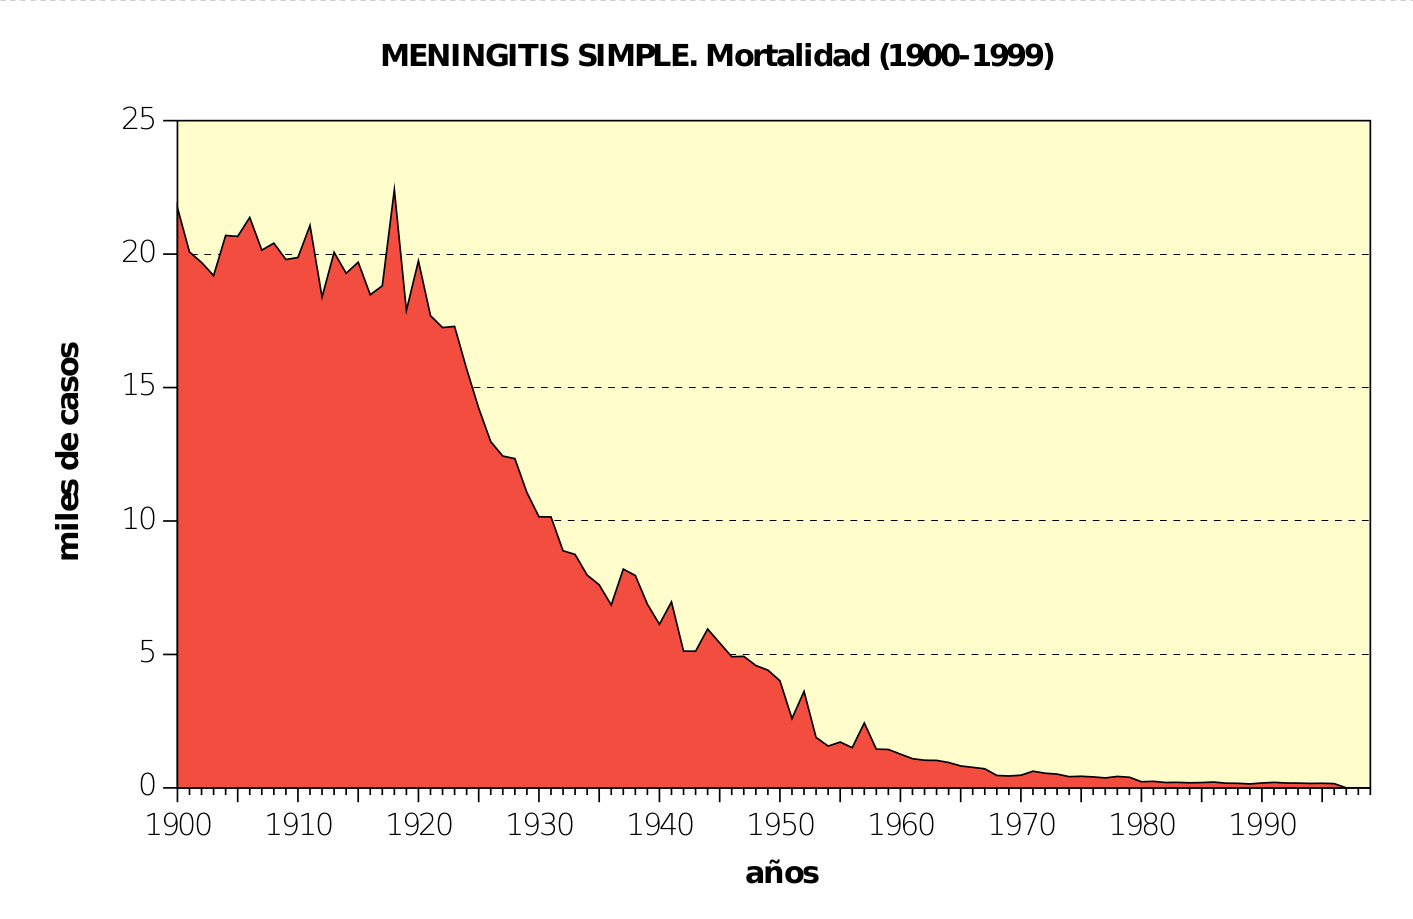
Figure 36 is a screenshot from page 290 of ANÁLISIS DE LA SANIDAD EN ESPAÑA
A LO LARGO DEL SIGLO XX.
Once again, the relevant vaccines were introduced long after this steep decline in mortality* and so we have yet another major 20th century Spanish mortality decline for which vaccines can be ruled out.
*What are the relevant vaccines? Meningitis is blamed on all kinds of things, but for each of these alleged infectious causes of meningitis the vaccines came late to Spain; Pneumococcal vaccines 2001, Meningococcal vaccines in 1997 (according to ANÁLISIS DE LA SANIDAD EN ESPAÑA A LO LARGO DEL SIGLO XX page 155), the Hib vaccine was authorized in Spain in 1994 and introduced to the vaccination schedule in Spain in 1998. Here in the US the CDC claims that measles, mumps, chickenpox and influenza can lead to viral meningitis too, but those vaccines also came late to Spain; measles and influenza in particular we will review momentarily.
Flu
Figure 37
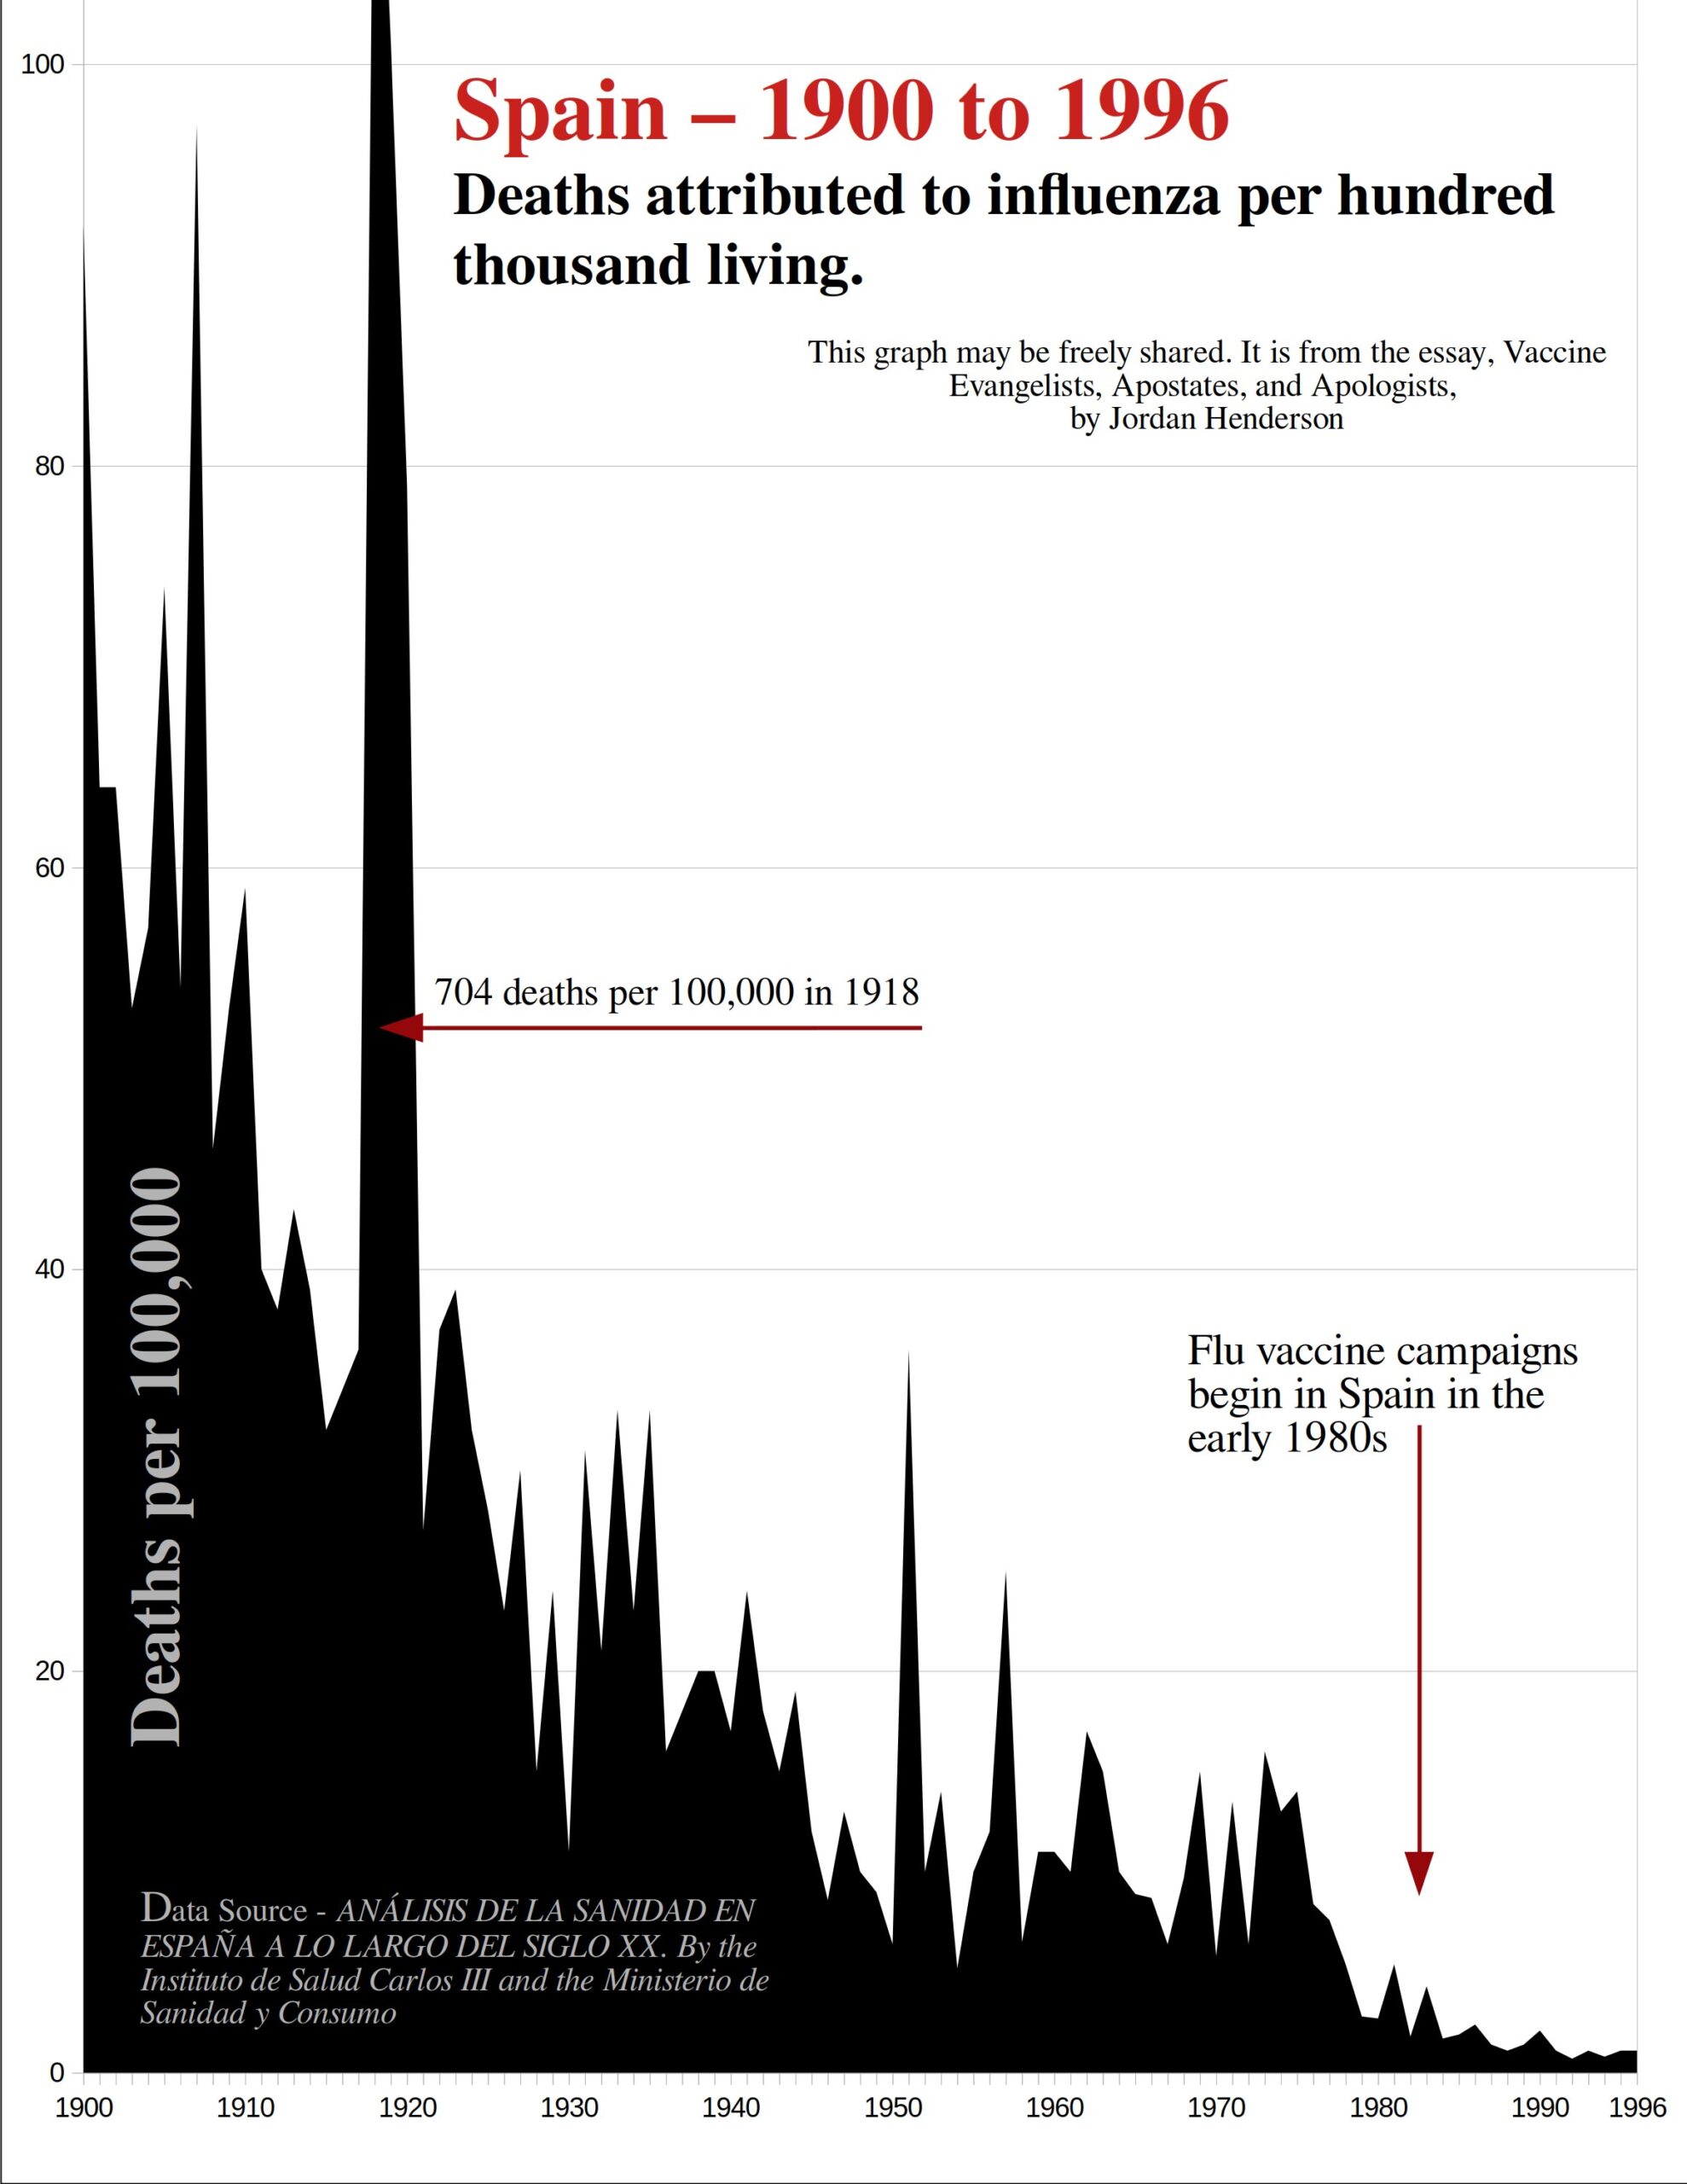
Yet another major mortality decline in Spain for which vaccines can be logically ruled out*
*I have not found detailed data for flu vaccines administered in Spain as is available for many of the other vaccines administered in Spain. However all accounts I can find say the introduction of flu vaccines in Spain occurred in the early 1980s: According to this published paper the flu vaccine was introduced in Spain in the early 1980s. This document published by a collaboration of Spanish medical, pediatric, and vaccination associations says the 1980s (page 9) as well. And finally here, in the Ask an expert section of the Asociación Española de Vacunología the question is asked as to when exactly the first flu vaccine campaigns occurred in Spain and the author of the well documented answer couldn’t offer an exact date other than the early 1980s, noting further that more extensive flu vaccine campaigns occurred later in the decade (implying by this I presume, that the campaigns in the early 1980s weren’t all that extensive).
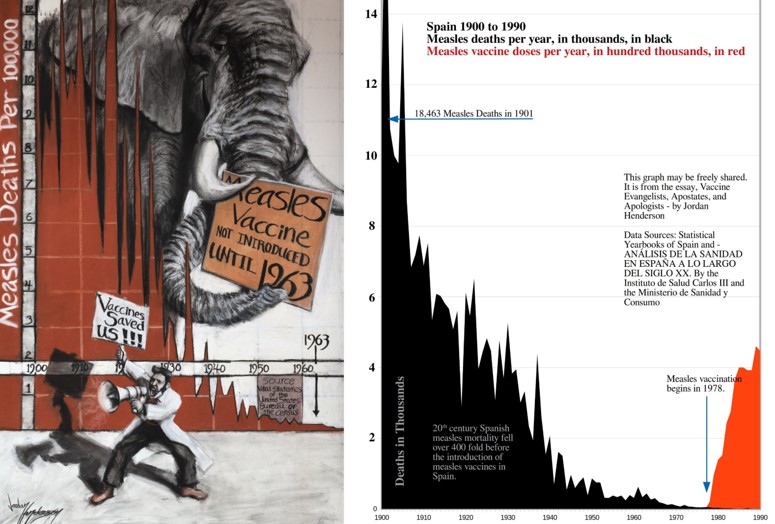
Measles
Figure 38
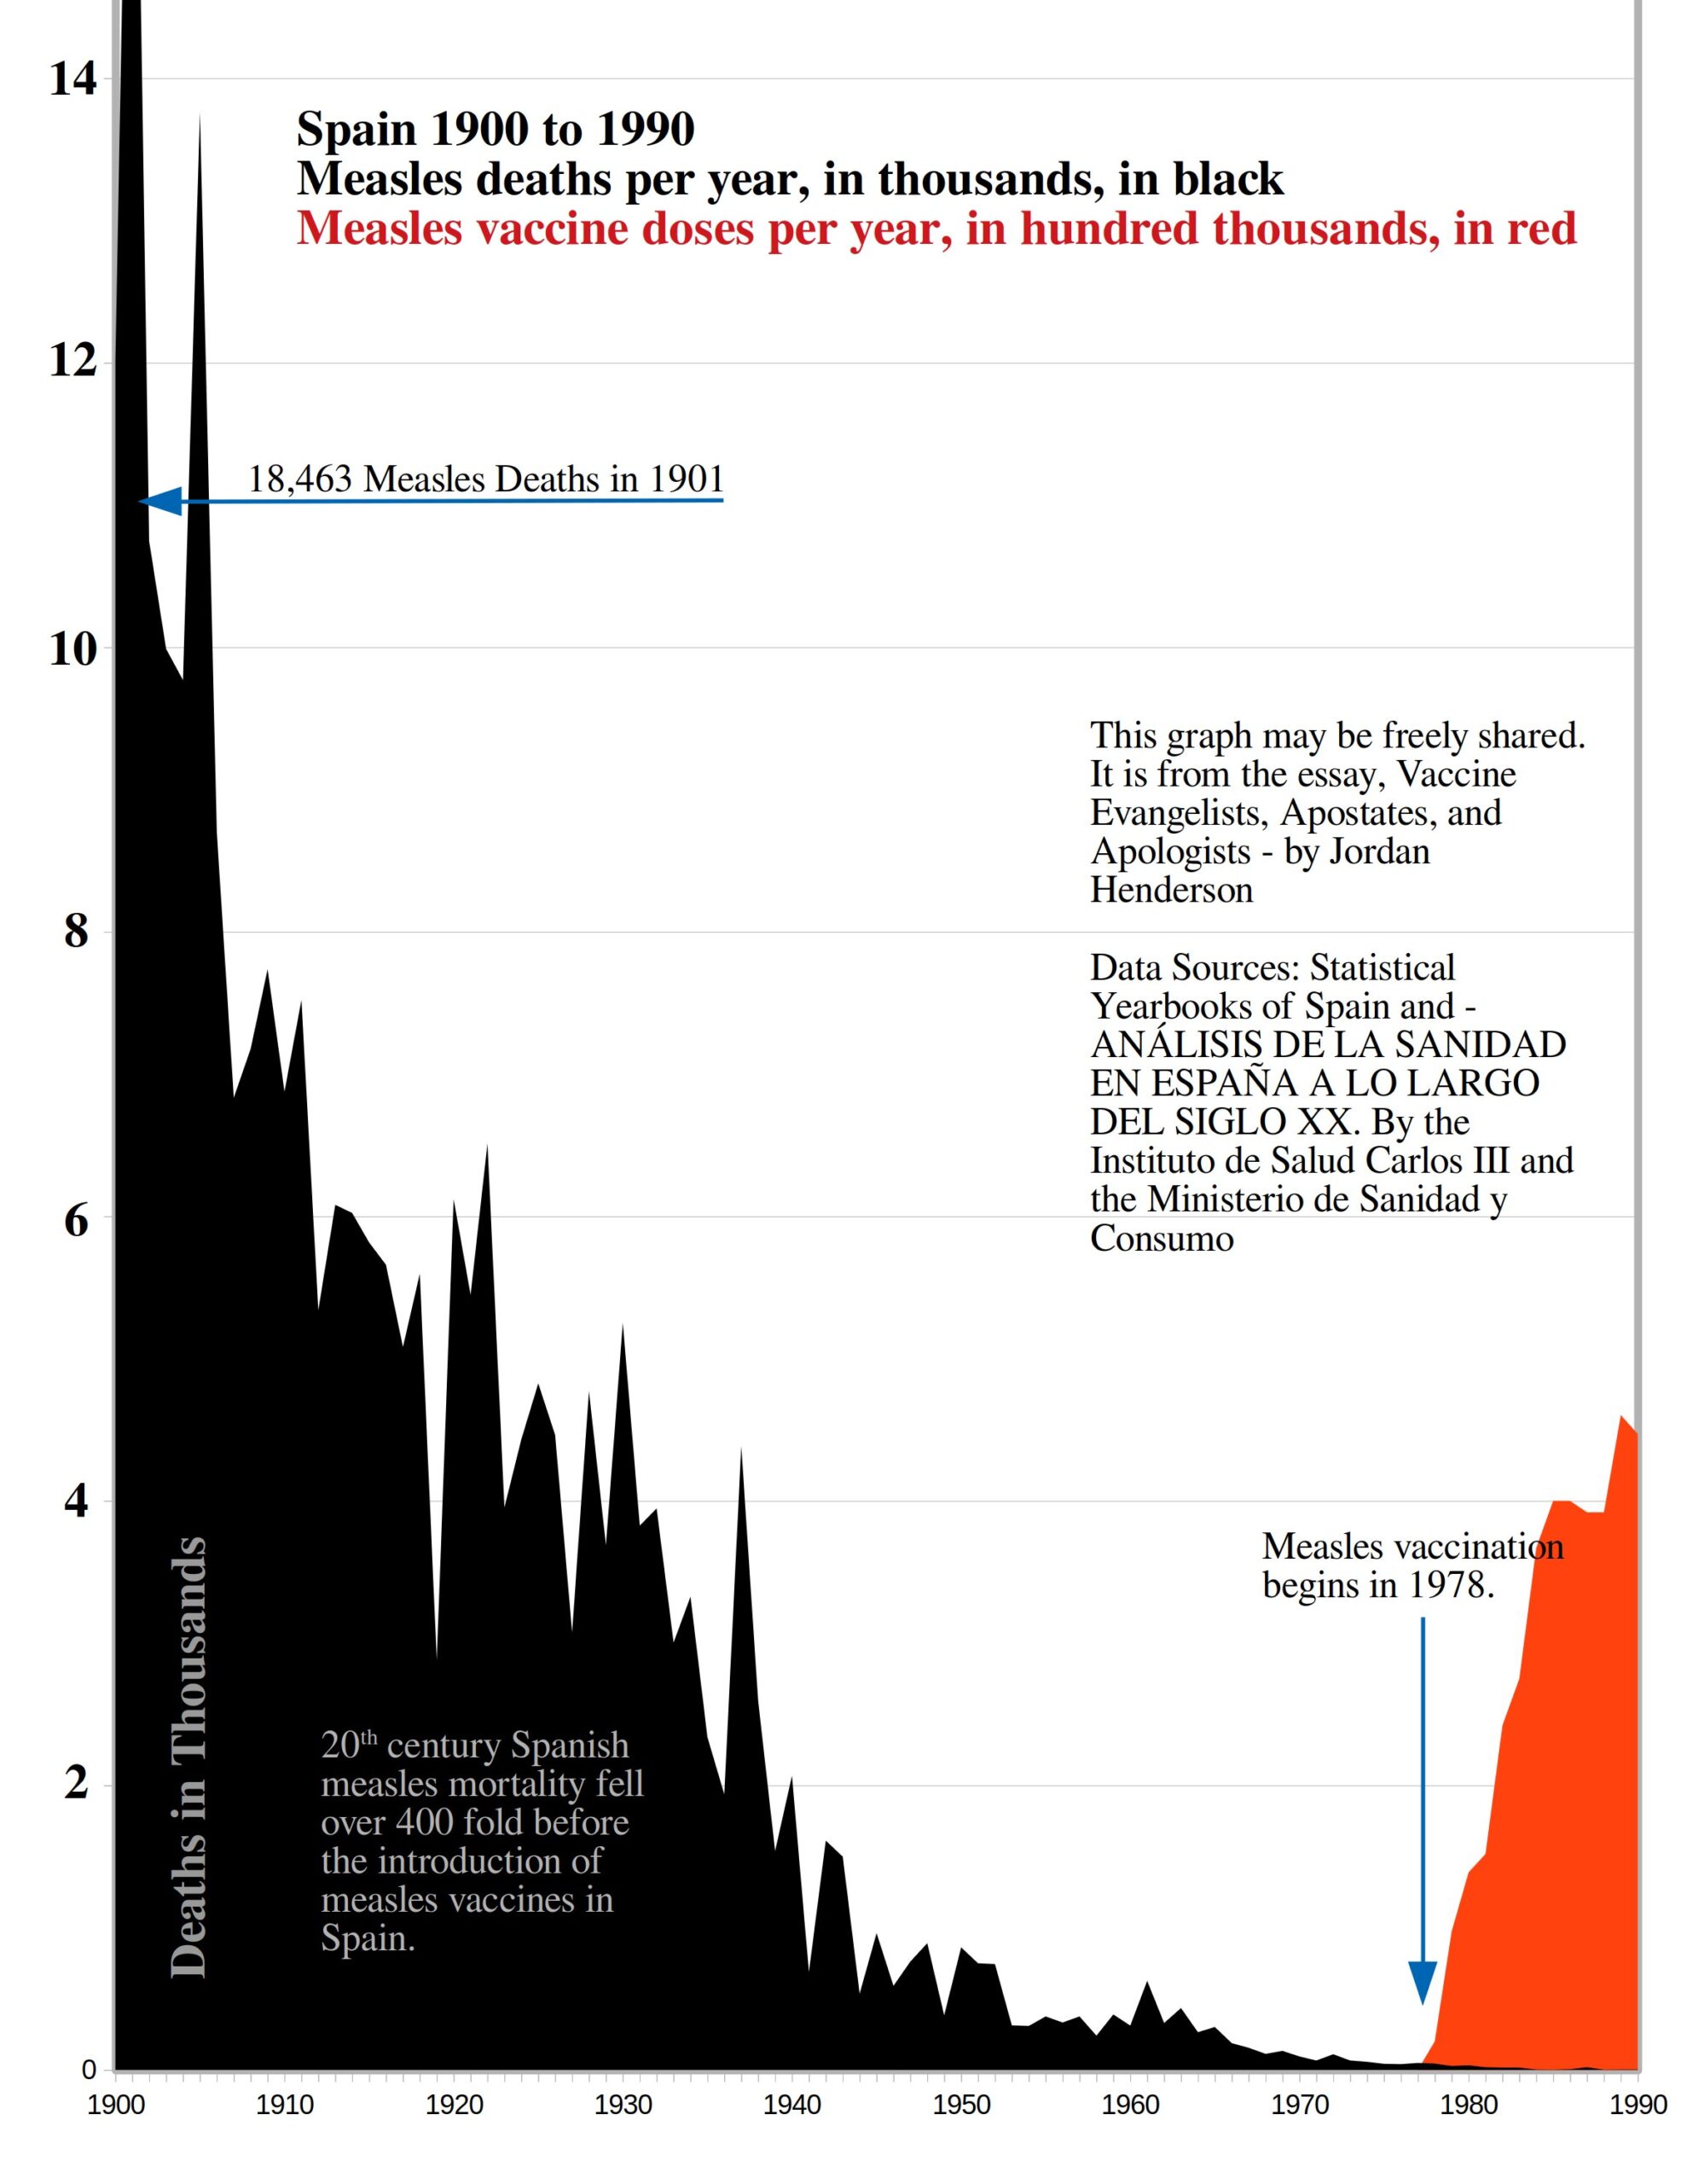
Yet another disease for which it could hardly be any clearer that vaccines were not responsible for the drastic mortality decline in Spain; they could not have been the primary reason, nor one of the primary reasons.
1901 was the worst 20th century year for measles mortality in Spain with 18,463 recorded deaths. By the mid-1970s Spain was averaging 43 deaths per year. That works out to a 429-fold reduction in measles deaths in Spain before the introduction of the measles vaccine.
Or we could state it as a 99.767 % reduction in 20th century Spanish measles mortality before the vaccine.
Notes for Figure 38:
- Measles deaths occurred overwhelmingly in the very young (1905 Here, 1906 Here) so Figure 38 is in actual number of deaths not a death rate for the reasons discussed in the first section of this essay.
- The vaccines in hundreds of thousands of doses shown on the chart takes into account both measles vaccine by itself and the measles vaccine doses as part of the combination MMR vaccine (page 238 of this document).
- I used the statistical yearbooks of Spain as my source document for deaths up till 1979, which is the last year for which I could get that data through the yearbooks, and then I used ANÁLISIS DE LA SANIDAD EN ESPAÑA A LO LARGO DEL SIGLO XX for measles deaths from 1980 to 1990 (the table on page 190). But I did find a couple discrepancies in the later document including that it records 81 measles deaths in Spain for 1981 which I suspected was a mistake. I couldn’t verify it through the statistical yearbooks as they don’t offer detailed cause of death after 1979, but I was able to find Spanish measles mortality for the 1980s in papers such as this one which confirmed my suspicion that 81 deaths in 1981 was a typo, it’s actually 19 recorded measles deaths in 1981, which is what I used in Figure 38.
Typhoid Fever
Figure 39
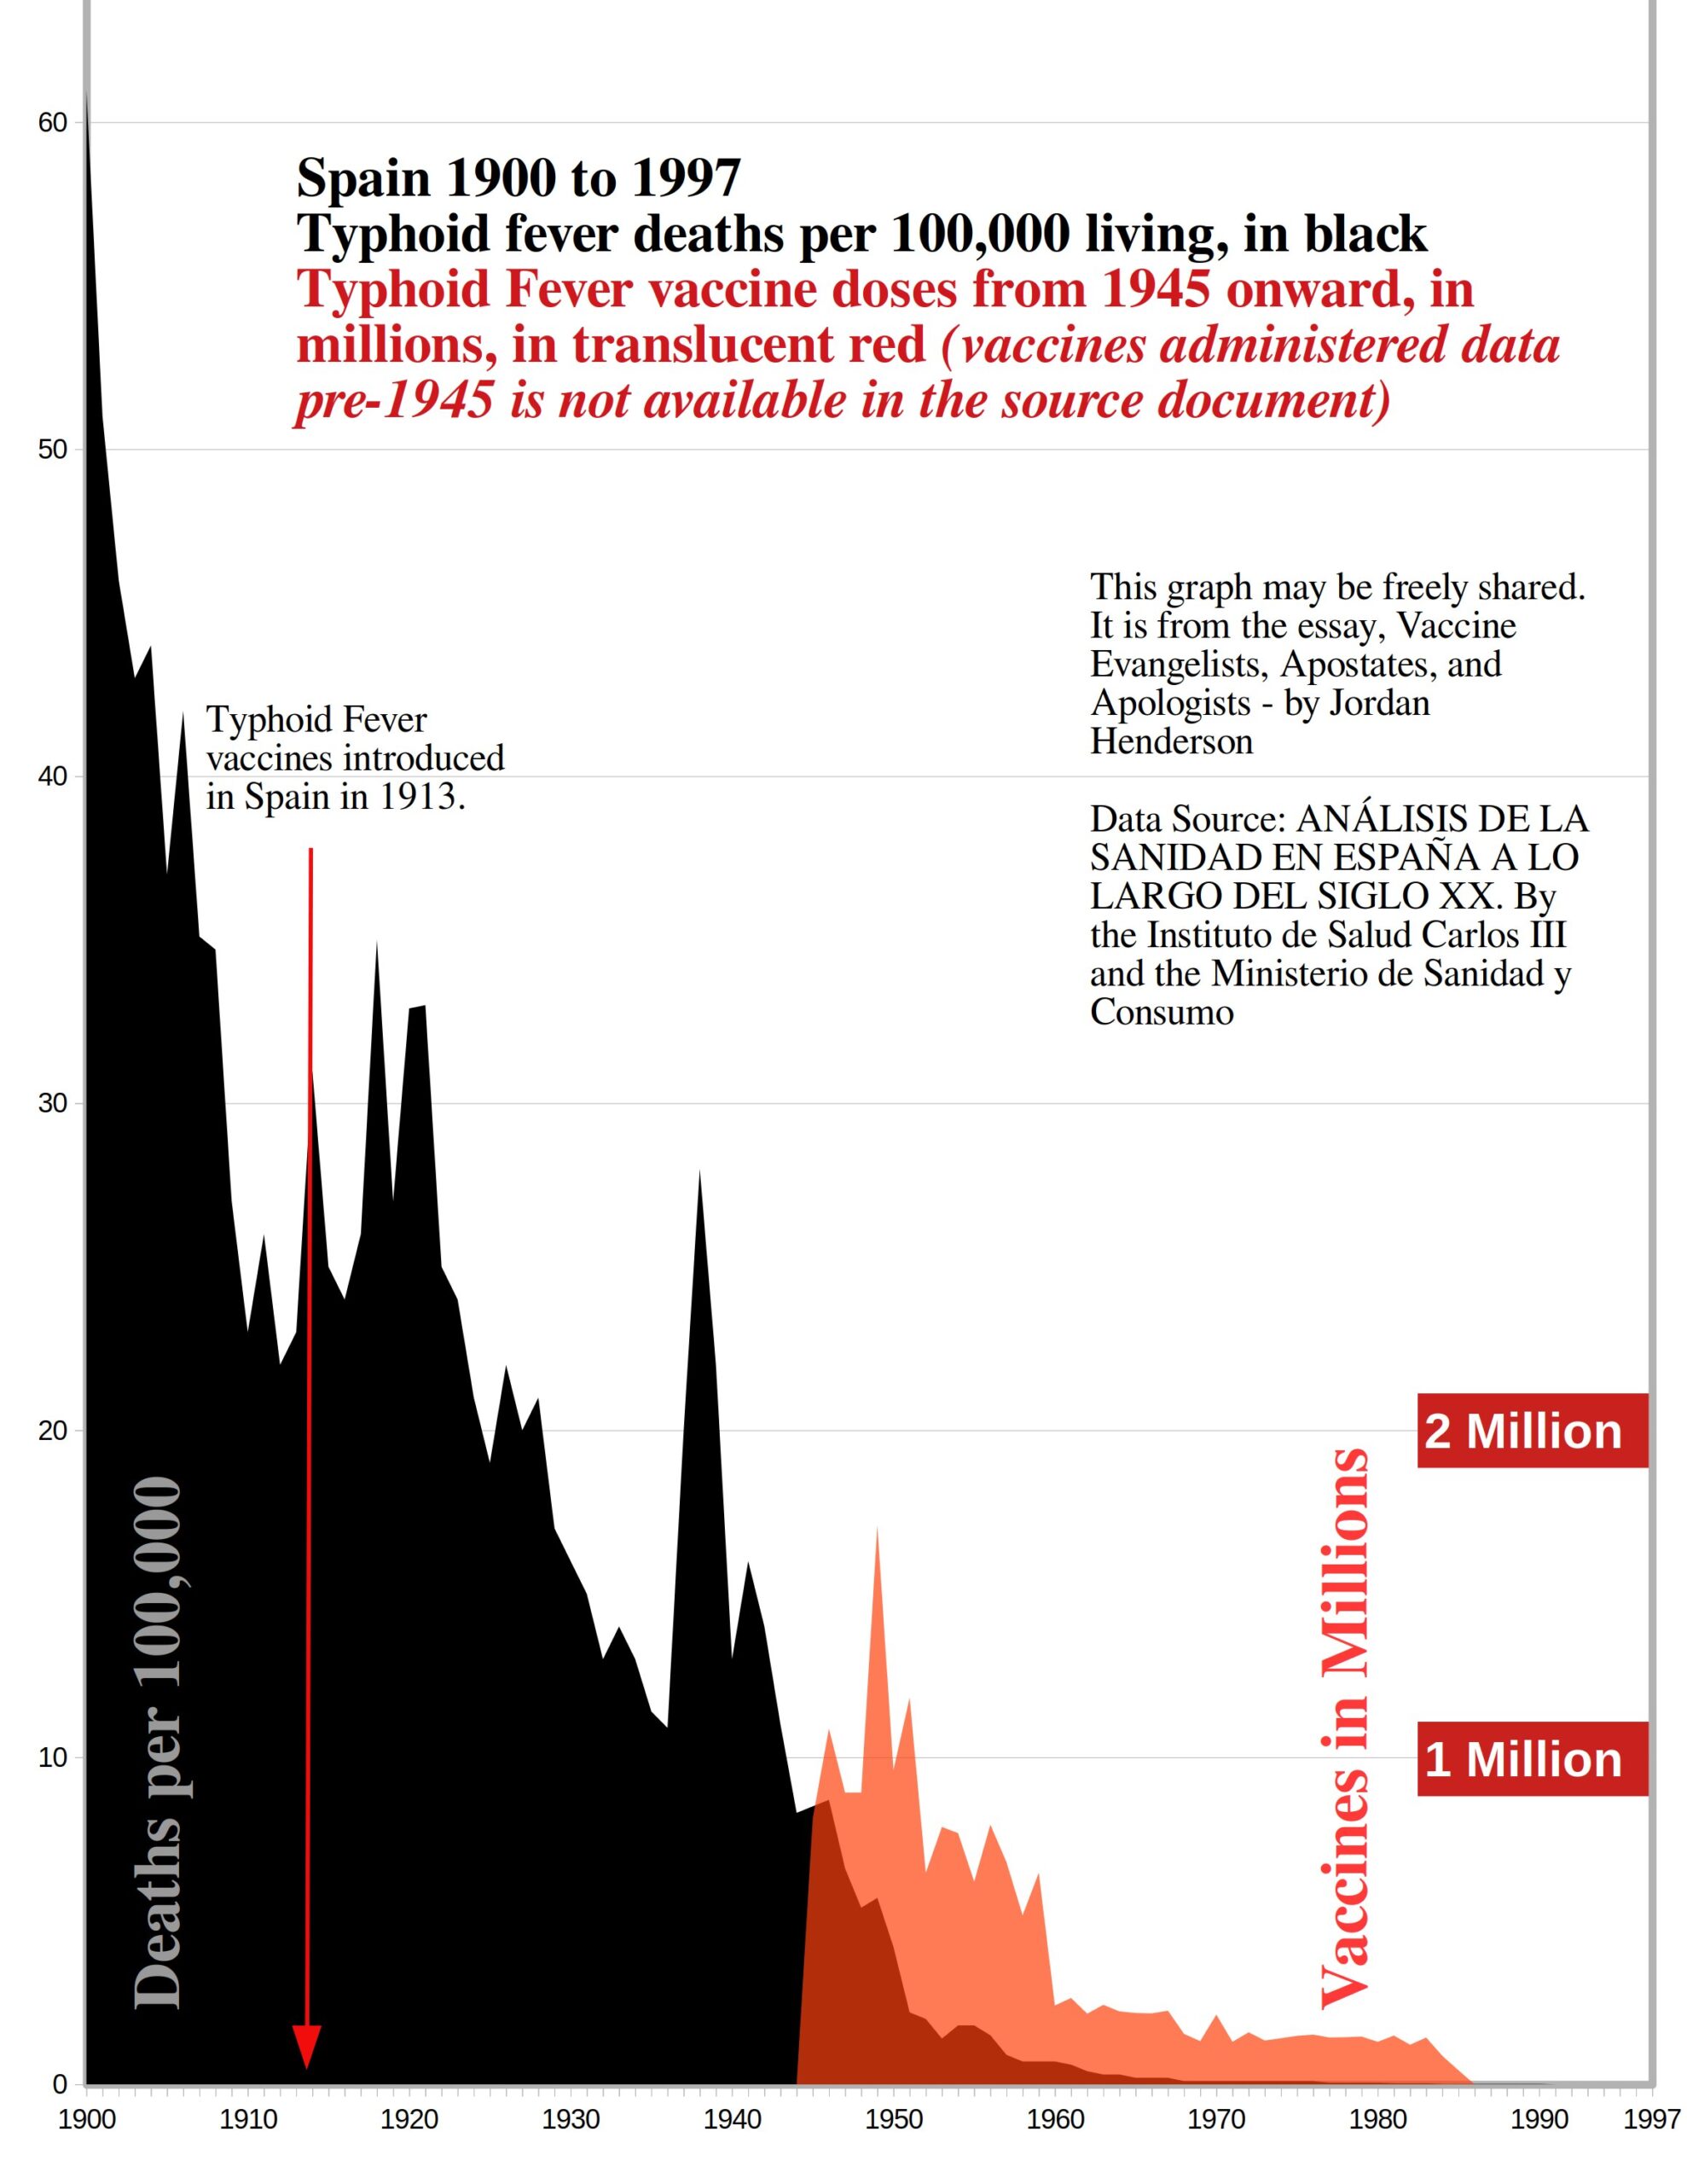
Typhoid fever was the eighth deadliest of the infectious diseases we saw in our comparisons earlier in this essay of 20th century infectious diseases in Spain (Figures 29, 30, and 31).
This illness is said to be caused by types of salmonella bacteria; sustained fever, and stomach pain are listed as symptoms. Typhoid fever is associated with poor sanitary conditions/contaminated water.
This is the first disease we’ve reviewed for Spain in which the relevant vaccines are introduced early enough that the vaccine could have hypothetically played a significant role in the mortality decline.
That doesn’t mean that typhoid fever vaccines did contribute significantly or at all to the typhoid fever mortality decline; it just means that we cannot so easily and definitively rule them out as we can for other diseases where the vaccines clearly come on the scene well after almost all the mortality decline.
To their credit the vaccinationists themselves generally do not hype typhoid fever vaccines with grandiose claims of their miraculous properties as they do for the other vaccines. The vaccinationists even generally recognize water quality as a substantially more important preventative factor for typhoid fever than vaccines.
Despite the graphical evidence for typhoid fever in Spain being logically much less clear cut than for the other diseases, it does nonetheless contain three pieces of information that are modestly unfavorable to the vaccine:
Firstly, we note that the single greatest decline in typhoid fever mortality for 20th century Spain occurred in the first decade of the century, before the vaccine was introduced.
Secondly, we see that typhoid fever mortality went up after the introduction of the vaccine. This reversal of the decline in typhoid fever mortality is not surprising, it is very similar to the reversal of the mortality decline in the other diseases that we have reviewed so far. Evidently, the years during and after World War I were harsh years for the Spanish population with conditions conducive to disease.
This is nonetheless moderately unfavorable to the vaccine because typhoid fever for which there was a vaccine during this time experiences a spike in mortality comparable to the many other diseases for which there wasn’t a vaccine during this time.
Thirdly, as you can see in Figure 39, the number of vaccines being administered plummets later in the century, without any corresponding spike in mortality. This is not what you would expect if the vaccines were actually a major contributor to the mortality decline.
These three reasons all indicate that typhoid fever vaccines were not a major contributor to the decline in typhoid fever mortality (I doubt that that they contributed to the mortality decline at all, but the graphical evidence presented here of course cannot be used to logically rule out these vaccines entirely; they were present and used early on in Spain and so could have hypothetically done something).
Notes for Figure 39
- Typhoid fever deaths were primarily recorded in adults (for the age breakdown see 1905 Here, 1906 Here). So, for the reasons mentioned in the first section of this essay installment, I presented the mortality in the graph using the death rate per hundred thousand data.
- Typhoid fever vaccines were introduced in Spain in 1913 with vaccine campaigns in Madrid that same year, and campaigns in Vigo the following year 1914 (see this paper, pages 110, and 111). And over here in this doctoral thesis on historical public health and hygiene in Valencia, we can read (on page 112), that the royal public health council in Spain approved and officially recommended typhoid vaccines in Spain in 1913.
- In the two documents linked to in the above paragraph I can find various information indicating at least somewhat widespread use of typhoid fever vaccines in Spain in the early 20th century, but I can find no hard data for actual numbers of vaccines administered nationally, or coverage rates before 1945. Yearly vaccines administered data for typhoid fever in Spain is available through beginning in 1945 as shown in figure 39 (data source – this document pages 237 and 238)
Diphtheria
Figure 40
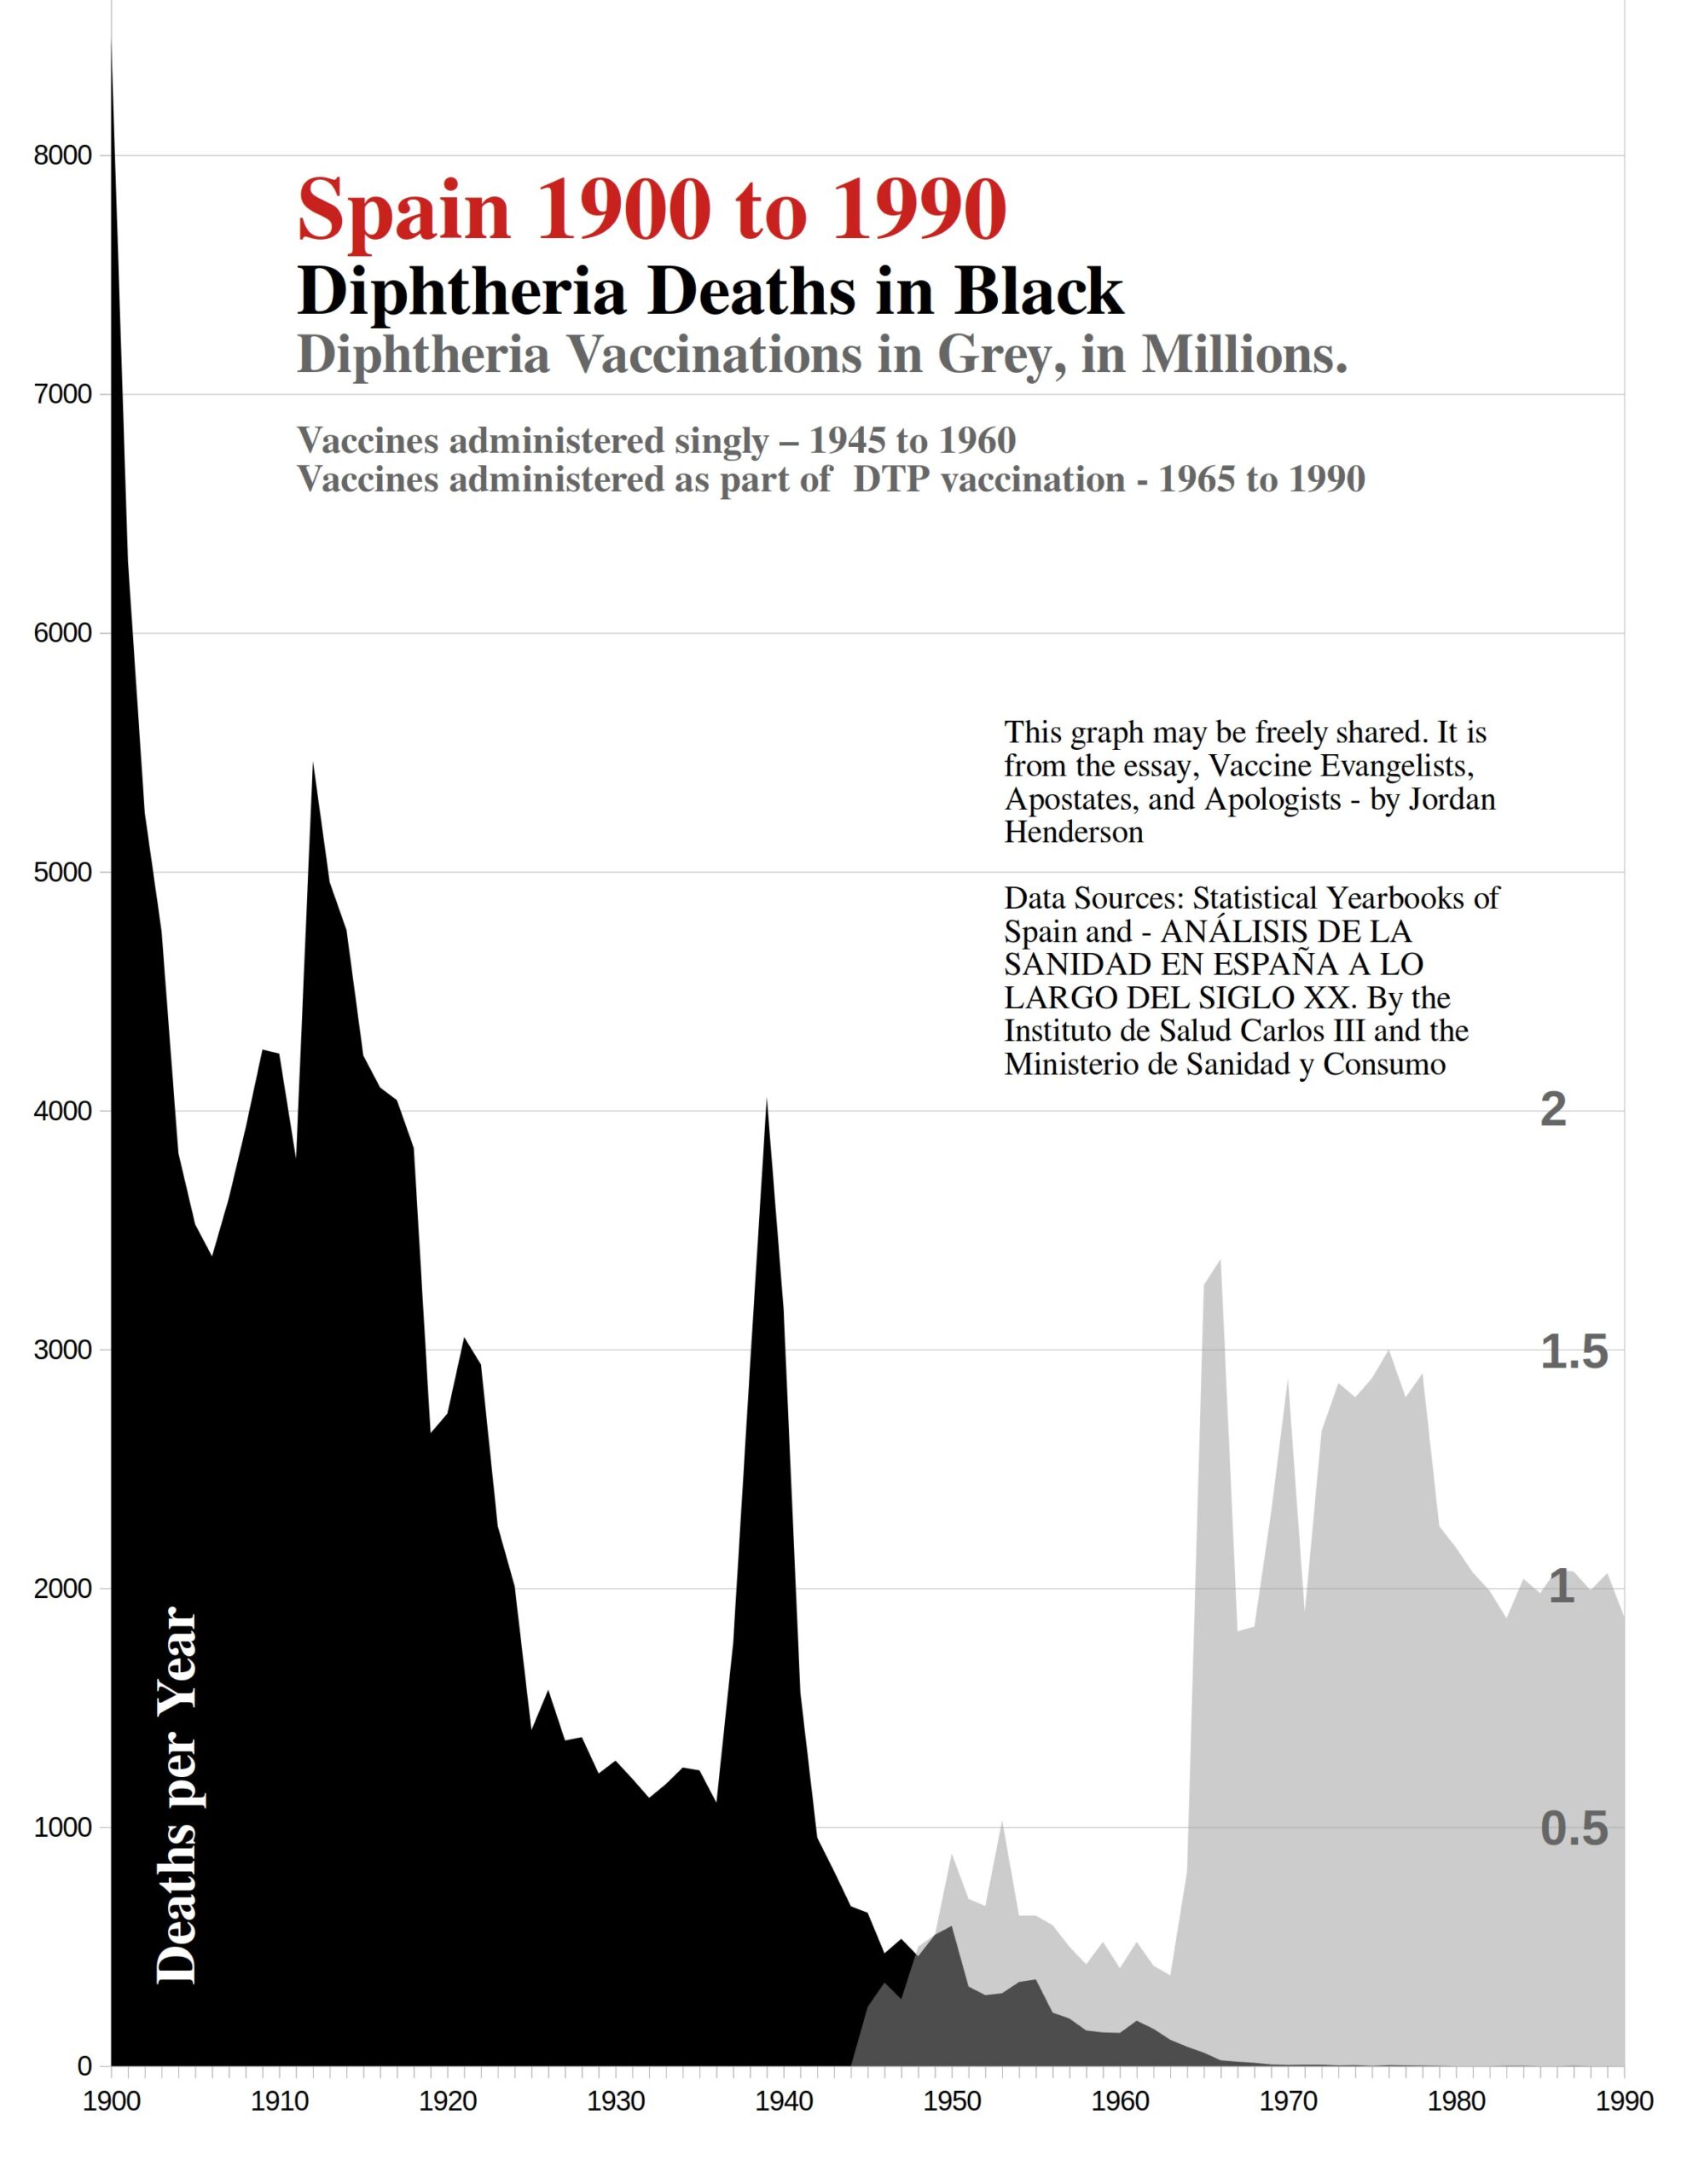
With diphtheria mortality in 20th century Spain, we see the familiar pattern of steep decline in mortality marked by two reversals with major spikes in mortality, corresponding roughly to the First World War (and evidently the years immediately preceding it), and the Spanish Civil War.
It is plain to see from the mortality profile juxtaposed with the vaccination data, that most of the reduction in diphtheria mortality occurred before widespread vaccination against it, and almost all the reduction in diphtheria mortality, over 99%, occurred before Spain achieved high levels of diphtheria vaccination through routine childhood vaccination efforts beginning in 1965.
Notes for Figure 40
- Most sources that I find list 1945 as the year that diphtheria vaccines were introduced in Spain (see Here on page 88, or Here on Page 4). Though some sources list 1943 as the year of introduction such as on page 115 of the Carlos III document.
It is regularly acknowledged that despite a 1945 law which made diphtheria vaccination obligatory in Spain, diphtheria vaccination coverage remained low or very low until the introduction of routing childhood DTP vaccination in Spain in 1965.
- The overwhelming majority of diphtheria deaths were recorded in children (For the age breakdown see 1905 Here, 1906 Here ) so for the reasons mentioned in the first section of this essay installment I presented the mortality in the diphtheria graph using the actual number of deaths rather than the death rate per hundred thousand.
(Smallpox – Parenthetical Statement –
– As mentioned earlier in this essay series, smallpox is being left to the side for the time being. Besides the Spanish data we are using for our graphical analysis of 20th century disease mortality in Spain isn’t near old enough for juxtaposing smallpox mortality and smallpox vaccines as smallpox vaccines are the oldest vaccines and were introduced in Spain in the year 1800 (see page 10 of the PDF linked too/page 86 in the original), which is100 years before national, yearly, cause of death data is available for Spain.
I’m including this parenthetical statement here simply to acknowledge that smallpox was the tenth deadliest disease in 20th century Spain in our comparisons (figures 29, 30, and 31). This is where we would have reviewed smallpox if we had old enough national data for Spain to do so, right after diphtheria which we just reviewed and before whooping cough which we are about to review.)
Whooping Cough
Figure 41
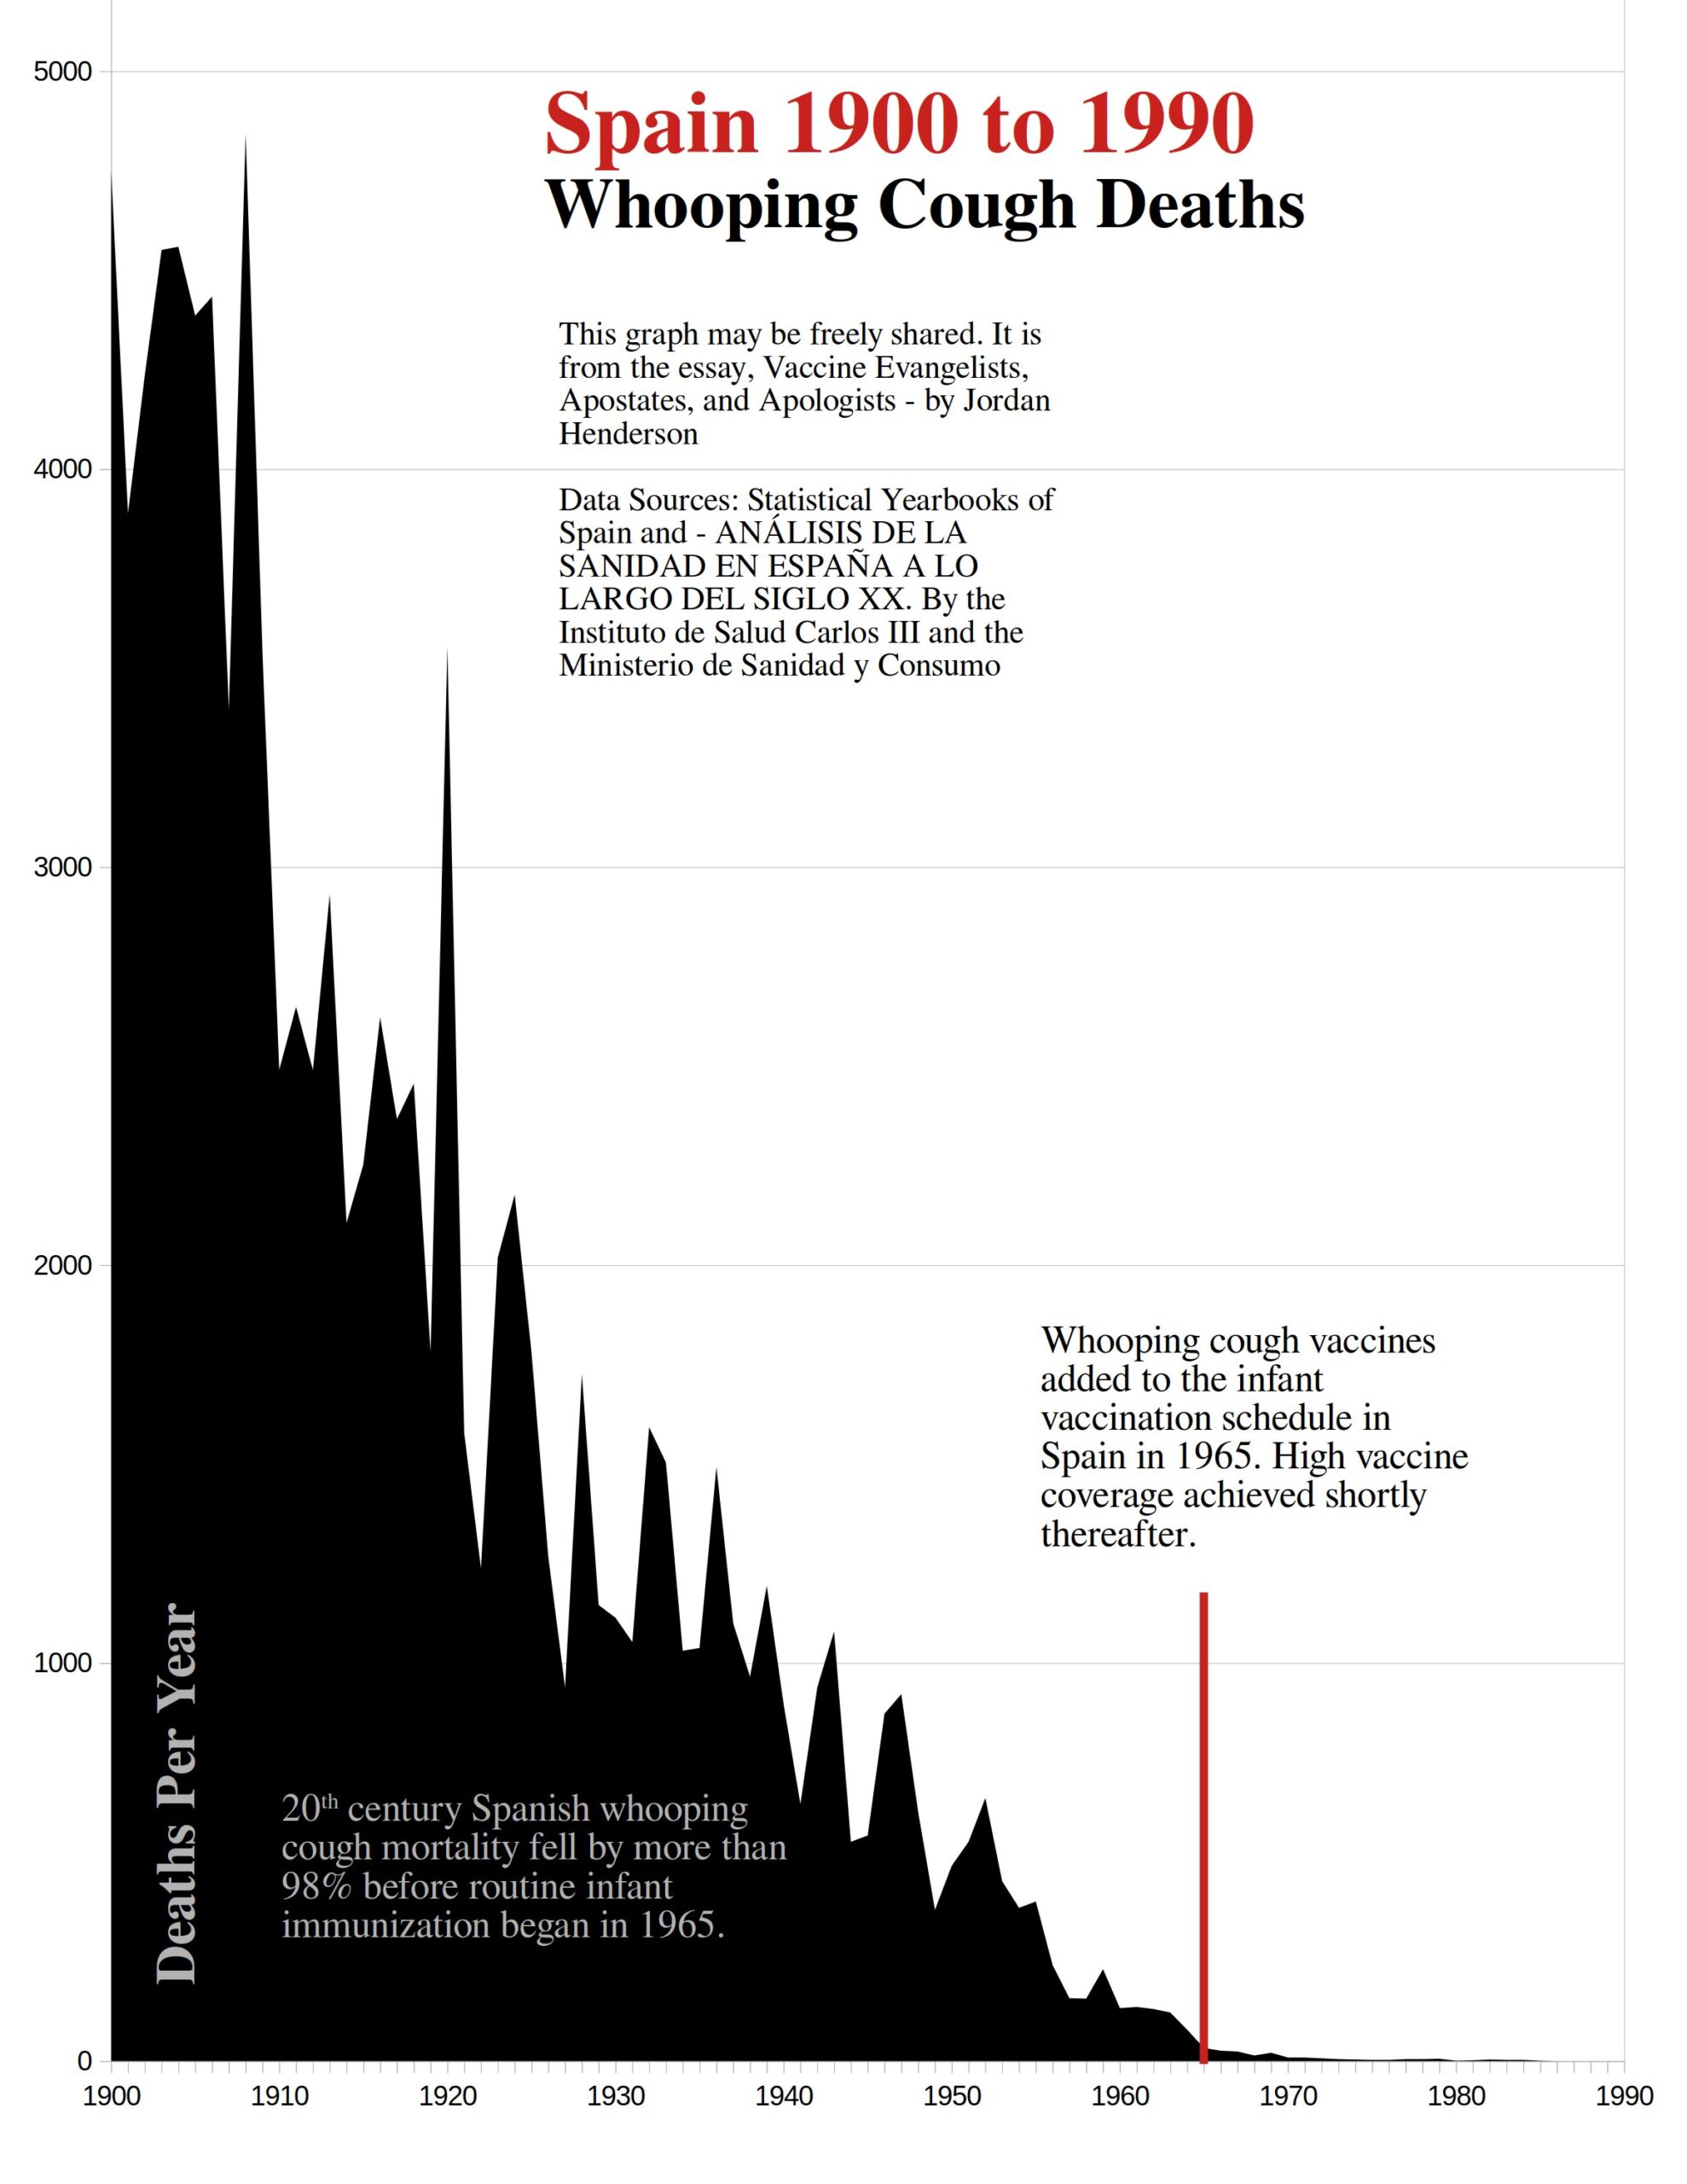
Spain added whooping cough vaccines to the infant immunization schedule in 1965 (page 21). That very same year, 1965, Spain administered nearly a million and a half whooping cough vaccines (See page 238 of this Carlos III document for vaccination data).
Impressively high vaccination rates right from the beginning of the program notwithstanding, it is clear that whooping cough vaccines were not, and could not have been the primary reason, nor one of the primary reasons, for the plummet in 20th century Spanish whooping cough mortality, almost all of which occurred before the introduction of routine infant whooping cough vaccination in Spain.
Note for Figure 41
- The overwhelming majority of whooping cough deaths were recorded in children (For the age breakdown see 1905 Here, 1906 Here ) so for the reasons mentioned in the first section of this essay installment I presented the mortality in the whooping cough graph using the actual number of deaths rather than the death rate per hundred thousand.
Dysentery, Puerperal Sepsis, Typhus, and so Forth.
We’ve moved a long way down our list of deadliest infectious diseases in 20th century Spain (Figures 28, 29 and 30), with each disease accounting for smaller and smaller fractions of the total infectious diseases mortality. At this point it is quite clear that vaccines were not and could not have been the primary reason, nor one of the primary reasons, for the drastic decline in infectious disease mortality in 20th century Spain. If you wish to work your way further down the list then don’t let the end of my graphical analysis of these diseases be the end of yours! The fabulously handy document ANÁLISIS DE LA SANIDAD EN ESPAÑA A LO LARGO DEL SIGLO XX contains graphs and tables for:
Dysentery – Pages – 119 to 191
Puerperal Sepsis – Pages – 193 to 195
Typhus – Pages – 209 to 211
Tetanus – Pages – 205 to 208
Polio – Pages – 177 to 180
And much more! The only one of these diseases with a mortality profile for 20th century Spain that when juxtaposed with the vaccine data is highly favorable to the vaccine (if the data is taken at face value) is polio.
While scarlet fever mortality was not all that high for 20th century Spain compared to the other diseases reviewed (14th on our list after, dysentery and puerperal sepsis, but before typhus, and tetanus, and still significantly higher than polio), I do want to provide a graphical review of scarlet fever for comparison with the other countries; we have previously reviewed scarlet fever mortality for the USA, England and Wales, and Australia, so we’ll briefly look at its mortality profile in Spain too.
Scarlet Fever
Figure 42
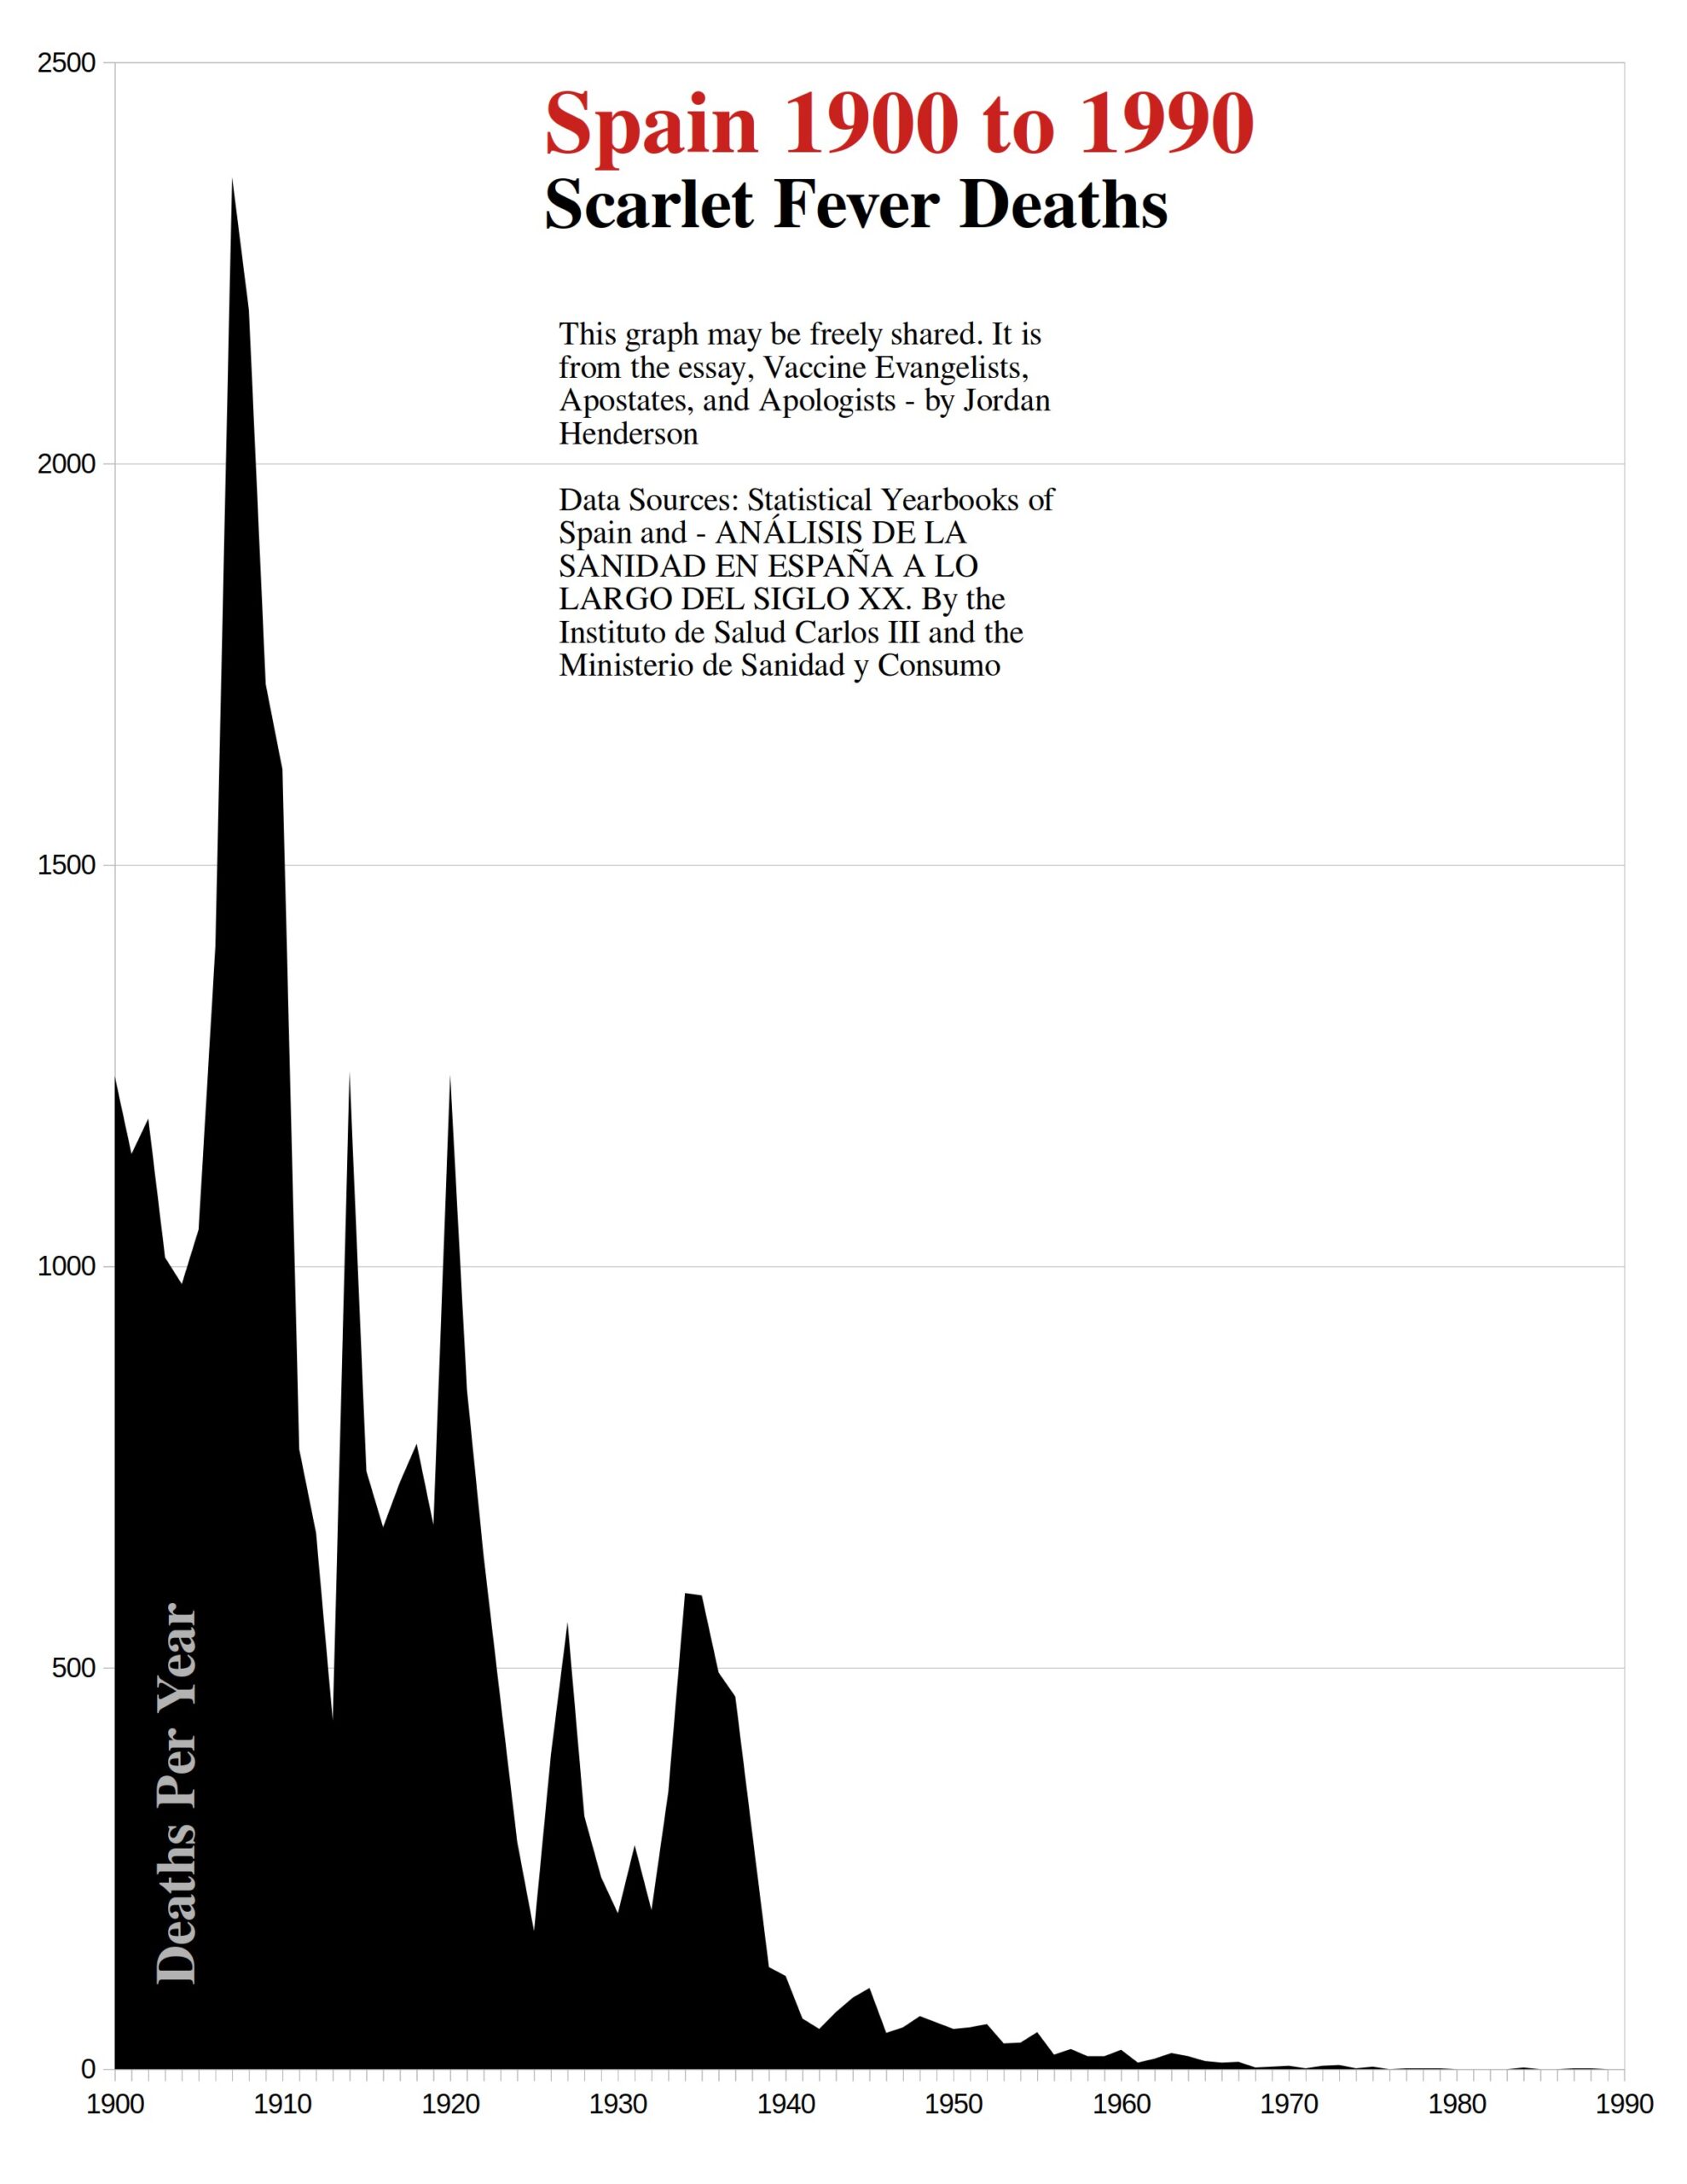
Generally, Spanish vaccine information websites (government run or otherwise) make no mention of scarlet fever vaccines, or simply state that there is no scarlet fever vaccine. The most I’ve found on this is some information on pages 248 and 249 of the 1946 February 15th publication of Revista Clínica Española (download link here), there they review various attempts at scarlet fever vaccinations in other countries, and conclude with an acknowledgment that widespread scarlet fever vaccination was currently not feasible in Spain.
So in Spain, as much as in the English-speaking countries, scarlet fever is yet another infectious disease with a steep mortality decline that cannot be attributed to vaccines.
Note for Figure 41
- The majority of scarlet fever deaths were recorded in children (For the age breakdown see 1905 Here, 1906 Here ) so for the reasons mentioned in the first section of this essay installment I presented the mortality in the scarlet fever graph using the actual number of deaths rather than the death rate per hundred thousand.
A Couple Ideas for Those Who Would Like to Support This Work
To those who would like to support my work, I offer the following three suggestions, any one or combination of which would be most helpful:
- Making a small single, or recurring donation to me through the donation page on my website (or a paid Substack subscription which is effectively a donation as all my essays are freely available), or making a purchase of a small print, mug, or greeting card, through my art prints website.
- Making a single or recurring donation to one of the independent media outlets (like this one!) who publish my work, and without whom few would see my work online to begin with.
- Supporting this work by getting the word out; sharing this article, and or sharing other notable works by me or the independent media outlets who bring my work to your attention. This increases our reach and makes us happy to know that our work is benefiting more people.
Up next: Part 5 – The Platitude of Vaccines and Water
The platitude of vaccines and water is yet another grandiose and popular form of vaccine evangelism in which vaccines are claimed to be second only to clean water in terms of lives saved.
Only clean water has saved more lives than vaccines.
We’ll look at some examples of this very popular genre of vaccine evangelism. We’ll drill down to see what basis if any there is to this claim. Then, to put the platitude of vaccines and water into perspective, we will consider some of the factors that are probable candidates for having historically played a major role in the drastic reduction in infectious disease mortality.
Jordan Henderson lives in Washington State in the Northwest of the United States. He works in oil paints, and charcoals. A portfolio of his works can be viewed at either of his websites: Original Paintings – Fine Art Prints
Become a Patron!
Or support us at SubscribeStar
Donate cryptocurrency HERE
Subscribe to Activist Post for truth, peace, and freedom news. Follow us on SoMee, Telegram, HIVE, Flote, Minds, MeWe, Twitter, Gab, and What Really Happened.
Provide, Protect and Profit from what’s coming! Get a free issue of Counter Markets today.
Be the first to comment on "Spanish Death Data – Part 4 of Vaccine Evangelists, Apostates, and Apologists."