
 By Tyler Durden
One month ago we warned that the toxic cocktail of Volcker-esque rates, which have pushed the average credit card APR to a nosebleeding 21%…
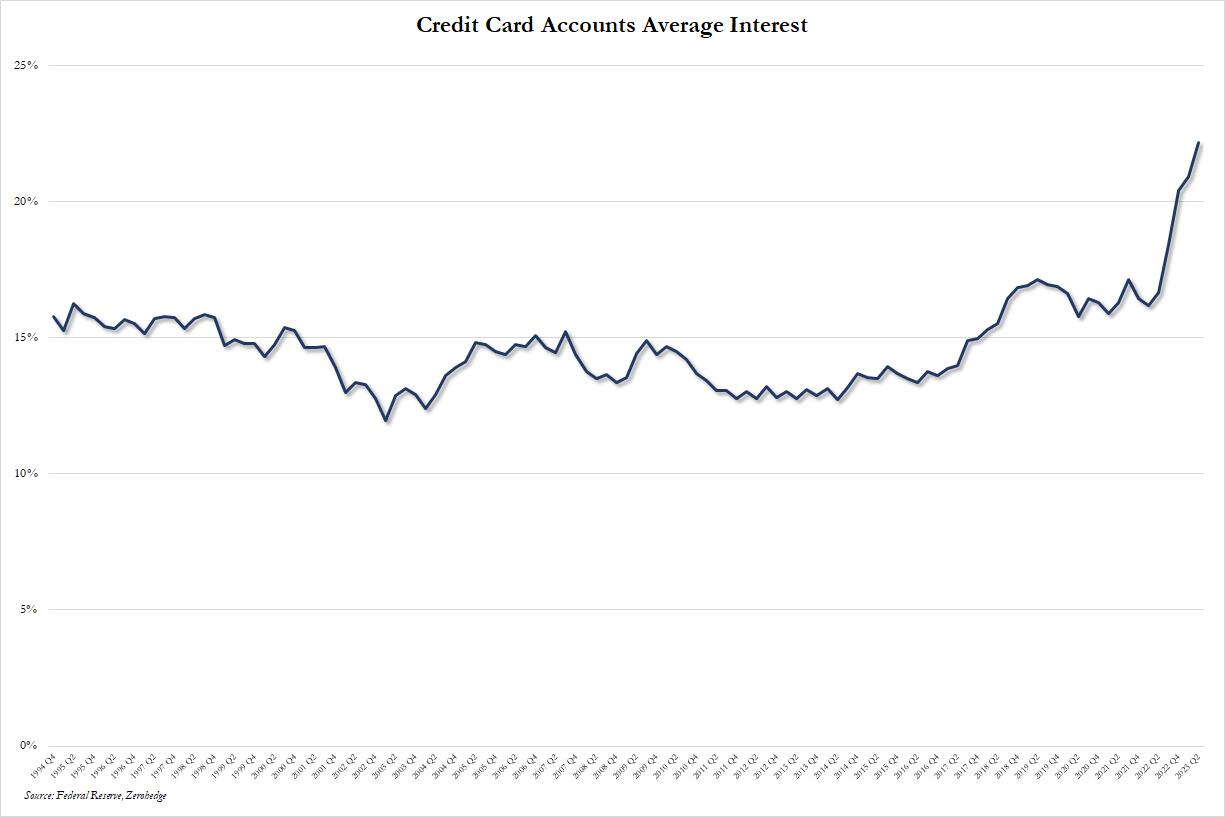
… and surging credit card balances would lead to a catastrophic surge in consumer (and corporate) defaults (see “Credit Card Balances Hit Record Above $1 Trillion, Suffer “Pronounced Worsening” Amid Surge In New Delinquencies“) it is now Goldman’s turn.
As Goldman analyst Ryan Nash writes in his latest note, after bottoming in September 2021, credit card losses have risen for the past 24 months. While the initial increases were likely reversals from stimulus, “since 1Q22 outside of the GFC losses are rising at their fastest pace in almost 30 years.” Nash is concerned because “it is unusual for losses to rise outside of an economic downturn. In fact, of the prior five credit card loss cycles, three were characterized by recessions (early ’90s, early 2000s and the great recession of 2008), while only two cycles (mid 90s and ’15 to ’19) the economy was not in a recession.”
Given this backdrop, Ryan’s did a deep dive comparing this cycle to the two prior non-recession credit loss increase / normalization cycles – 1) the mid-’90s cycle and 2) the prior credit cycle (2015-2019) to asses where losses could be headed over the course of this cycle and the timing of it.
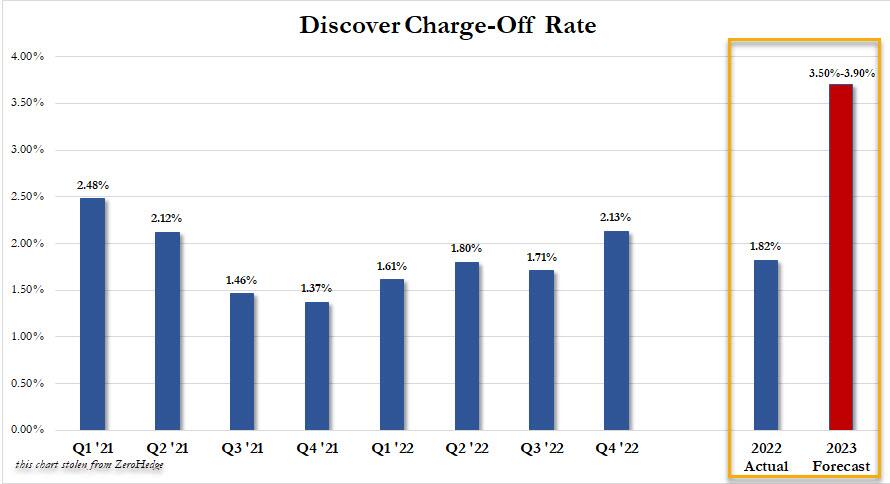
Losses currently stand at 3.63% (up ~150bps from the bottom) and based on Goldman’s analysis, the losses will rise at least another ~130ps from current levels (to ~4.93%), implying we are roughly halfway through the credit loss increase cycle. He also thinks delinquencies could continue to underperform seasonality through the middle of next year and don’t see losses peaking until late 2024 / early 2025 for most issuers. Relative to expectations, Goldman sees losses rising the most at COF, followed by DFS, which is hardly surprising following the credit card company’s own charge-off rate forecast.
Activist Post is Google-Free — We Need Your Support
Contribute Just $1 Per Month at Patreon or SubscribeStar
Below we excerpt some of the note’s highlights:
Nash starts off by setting the scene: we are currently in the 6th “credit normalization” cycle in the past 30 years.
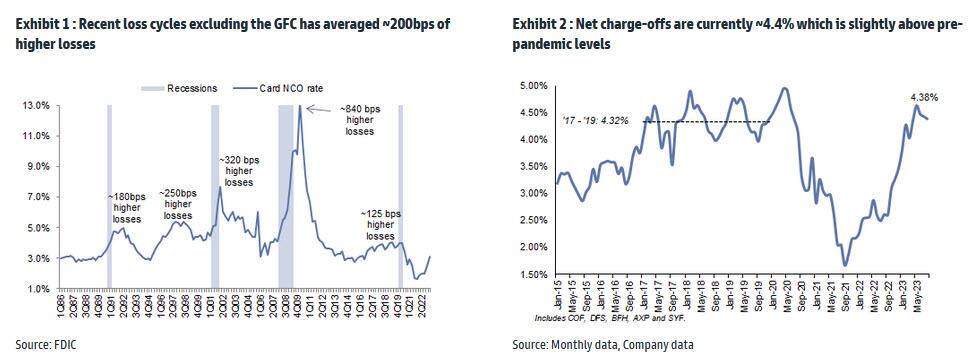
Of the prior five cycles, three were characterized by recessions (early ’90s, early 2000s and the great recession of 2008). In each of those cycles losses rose anywhere between 180bps to 840bps (~200bps on average ex. Great Recession).
Goldman next looks at credit normalization during the mid 1990s as well as the past credit cycle (2015-2019) and their characteristics (such as loan growth) and draw comparisons vs. the current cycle. In their view, this cycle resembles the characteristics of what was experienced in the late 1990s and somewhat similar to the ’15 to ’19 cycle where losses increase following a period of strong loan growth and has seen similar pace of normalization thus far this cycle.
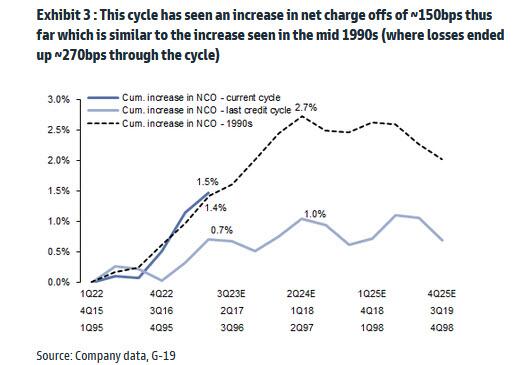
In the next chart, Nash compares credit loss increased during the ’15 to ’19 credit cycle and mid-’90s to the current cycle. In the mid-’90s, losses rose ~270bps over a 3½ year period despite unemployment improving, jobless claims were falling and the economy was not in recession. Last credit cycle, we saw losses increase ~100bps and Goldman attributes the more benign normalization vs. the mid-1990s to slower growth, a more consolidated industry (i.e. rational competition), and leverage increasing at a slower pace.
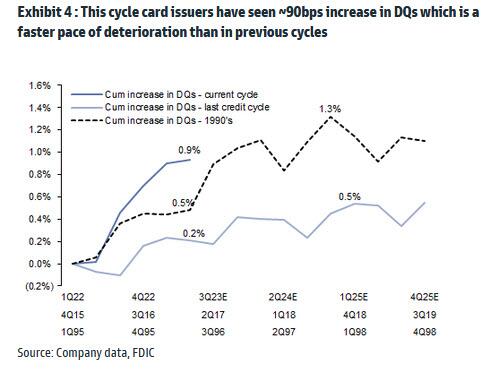
As shown in Exhibit 4, cumulative losses have increased ~150bps since 1Q22 (increases up until that point reflected a reversal of stimulus impacts). At this point in the credit loss normalization cycle in the mid-’90s, losses were up ~140bps and ~70bps last cycle. During the mid-’90s losses proceeded to increase another 130bps, peaking at +270bps for the cycle before leveling off and beginning to fall while losses during the last credit cycle only increased another 30bps over the remainder of the cycle. In Exhibit 4, we show that DQ normalization has occurred at a faster pace this cycle (up ~90bps vs. ~50bps at this point in the mid-’90s and 20bps at this point last cycle). During this cycle, losses have increased the most for BFH, COF and SYF while AXP, BAC, C-GP, and JPM have seen slower normalization.
The next question asked by Goldman is how long until the default cycle peaks. To answer it, the bank takes a closer look at the timing of when credit losses peaked in prior cycles, and concludes that following the peak in loan growth, it generally takes ~18 months for DQs to stop underperforming historical seasonality (suggesting sometime in the mid-2024 this cycle) and ~7-8 quarters following the peak in loan growth for losses to peak (implying losses peak late 2024 / early 2025).
Exhibit 11 shows that during the mid-90s card losses did not peak until approx. 6 quarters after growth peaked (30D+ DQs leveled out 3 months before that) and on ~5 quarters to reach peak on a YoY basis. Exhibit 13 shows that last cycle card losses did not peak until approx. 8 quarters after growth peaked while 30D+ DQs leveled out 3 months before that as growth occurred at a more measured pace (multi year time horizon) and was staggered across issuers.
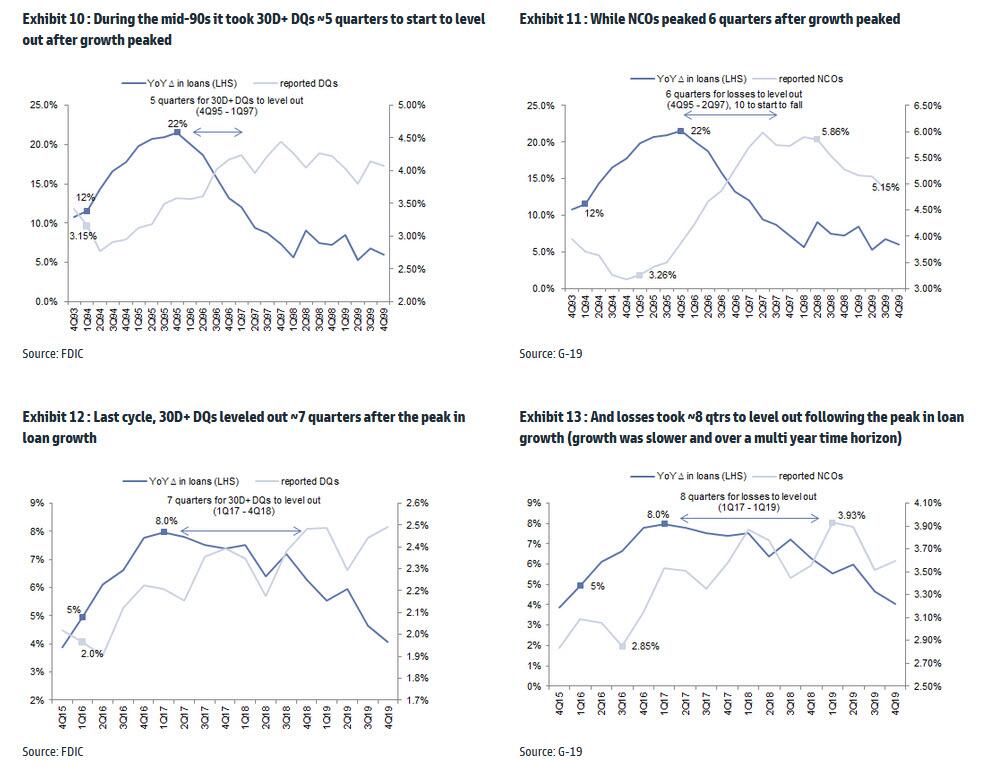
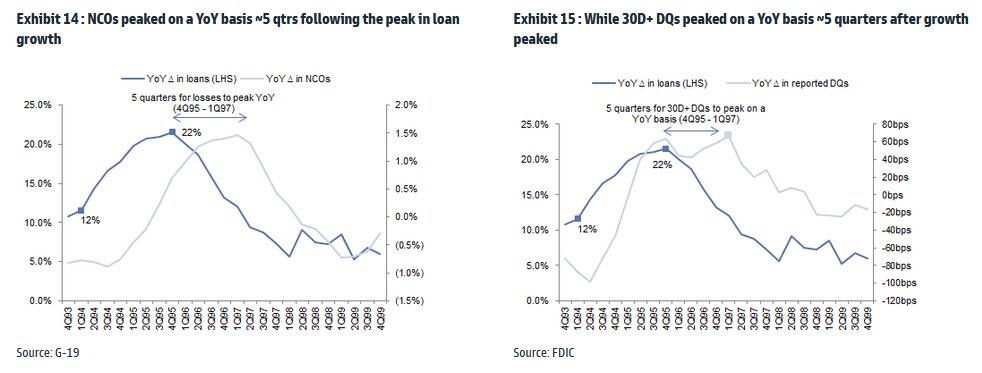
During the mid-’90s, net charge offs peaked on a year over year basis ~5 quarters following the peak in loan growth. However, we wouldn’t draw conclusions around this for this cycle since the back-book is still normalizing (more on this later) and also the YoY increase in losses this cycle has been faster given the dip losses took post stimulus.
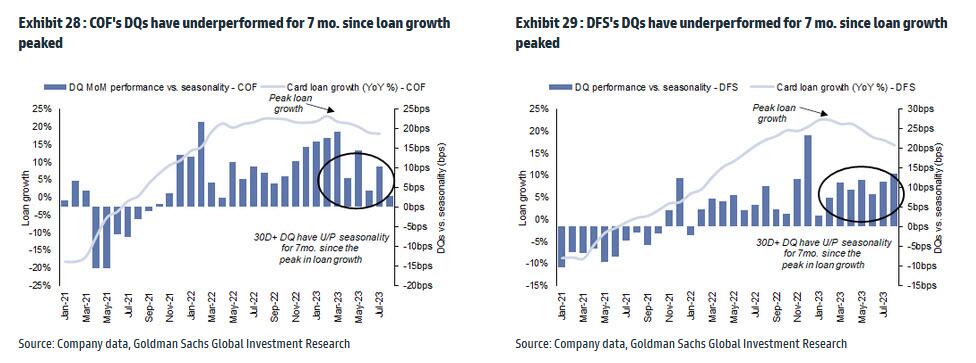
Next question: when will delinquencies stop underperforming seasonality?
Goldman shows, using data from DFS and COF, that 30D+ DQs have underperformed this cycle for ~6 straight months since the peak in loan growth. This suggests that we are less than half-way through the DQ underperformance cycle and implies that 30D+ DQs will continue to underperform vs. seasonality through at least the middle of 2024.
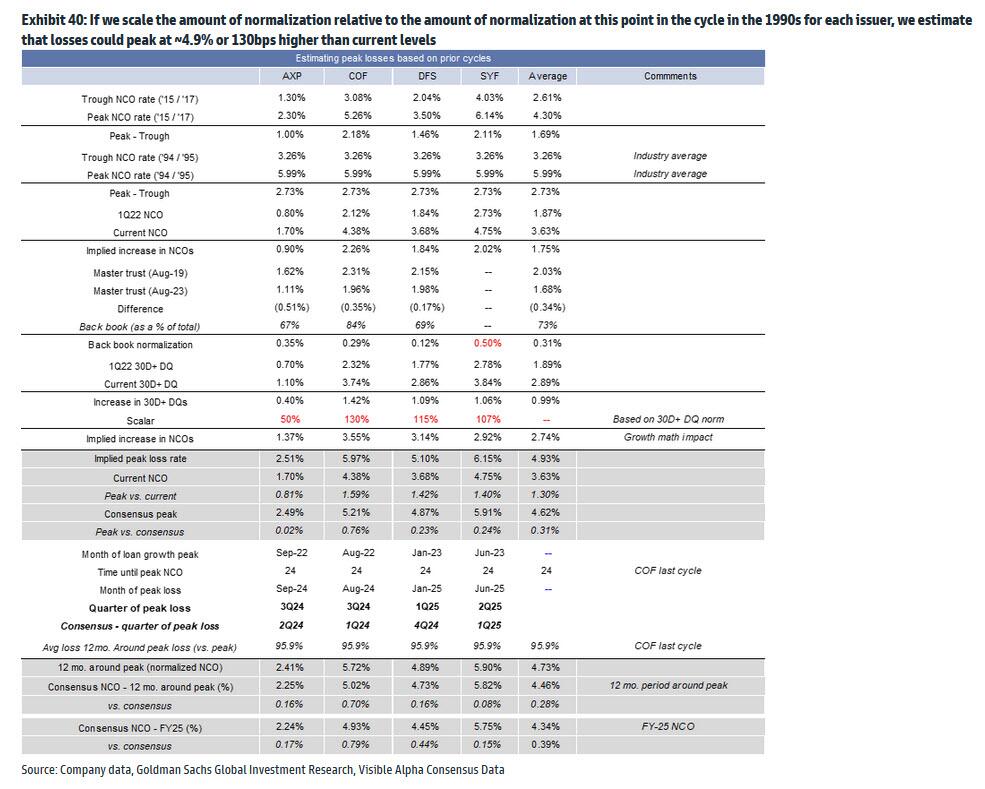
In the next section, Goldman puts together all the data, and in an attempt to quantify exposure and credit losses by issuers, sees losses increasing another ~130bps to peak levels which will occur sometime later in 2024 or early 2025 for most issuers. As shown in the next chart, the bank expects most issuers to see peak losses later in 2024 / early 2025 – around the time the next recession is truly raging – and estimates that losses could peak at ~4.93% or 130bps higher than current levels. Of course, if a perfect storm hits – the same way it did in 2008, and with the Fed desperately needing a big enough crisis to trigger deflation and launch the next QE – the losses will peak much, much higher.
More in the full note available to professional subs.
Source: ZeroHedge
Become a Patron!
Or support us at SubscribeStar
Donate cryptocurrency HERE
Subscribe to Activist Post for truth, peace, and freedom news. Follow us on SoMee, Telegram, HIVE, Flote, Minds, MeWe, Twitter, Gab, and What Really Happened.
Provide, Protect and Profit from what’s coming! Get a free issue of Counter Markets today.
Be the first to comment on "Credit Card Losses Are Surging At The Fastest Pace Since The Global Financial Crisis"