

Economist Jeremy Horpedahl dismissed the silly claim by anticapitalists that capitalism must engineer food scarcity for the sake of profits. He presented a graph of Bureau of Labor Statistics (BLS) data demonstrating a substantial decrease in household food expenditure as a percentage of income—from 44 percent in 1901 to a mere 9 percent in 2021. This is something to celebrate and certainly can be attributed to the abundance of market economies.
But when Jordan Peterson asked, “And what’s happened the last two years?” I went digging. First, I confirmed Horpedahl’s observation: the amount we spend on food as a proportion of our budget has fallen dramatically. Second, I saw what Peterson hinted at: a significant spike in food spending when covid and the associated mess of government interventions hit (figure 1).
Figure 1: Food and personal consumption expenditures, 1959–2023
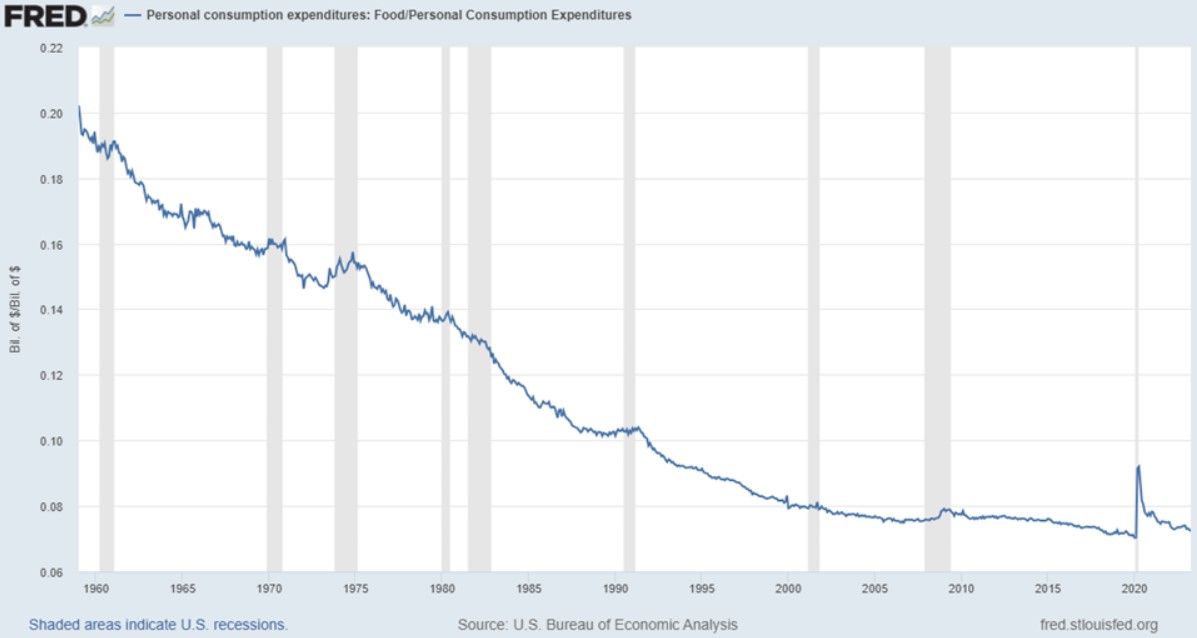
Source: US Bureau of Economic Analysis, FRED.
Interestingly, the spike looks like a blip. Someone oblivious to the events of the past few years might see this chart and say, “Yeah, something strange happened in 2020, but it looks like everything is back to normal.” I’m certain that this doesn’t align with anyone’s experience, however. Even today, no one would say that restaurant visits and grocery store trips cost the same as they did in 2019.
What changed in 2020? Why does this graph not feel right? Assuming the Bureau of Economic Analysis data isn’t totally off (and it is important to be skeptical of government data), why would a January 2023 report on consumer inflation sentiment conclude that “there is a disconnect between the inflation data reported by the government and what consumers say they now pay for necessities”?
The difference lies in the qualitative aspects of our experience as consumers. Spending proportions may have returned to their trend, but that isn’t the whole story. “Shrinkflation” and “skimpflation” have taken their toll on the quantity and quality of the food we enjoy—or maybe the food we tolerate is more apt.
Sovereign Man Confidential – Premium Intelligence Membership
Businesses know that charging higher prices is unpopular, especially when many consumers are convinced that greed is driving price inflation. So businesses resort to reducing the amount of food in the package, diluting the product but keeping the same amount, or otherwise cutting corners in ways that consumers may not immediately notice.
Thankfully, websites such as mouseprint.org document some of these cases:
- Sara Lee blueberry bagels reduced from 1 lb., 4.0 oz. per bag to 1 lb., 0.7 oz.
- Bounty “double rolls” reduced from 98 sheets to 90 (how is it still a “double roll”?)
- Gain laundry detergent containers reduced from 92 fl. oz. to 88 fl. oz. without any obvious difference in the size of the container
- Dawn dish soap bottles reduced from 19.4 fl. oz. to 18.0 fl. oz.
- Green Giant frozen broccoli and cheese sauce packages reduced from 10.0 oz. to 8.0 oz. with no change in the advertised number of servings per package
In some instances of skimpflation, the volume or weight of a product remains the same, but the proportions change. For example, Hungry-Man Double Chicken Bowls (a frozen dinner of fried chicken and macaroni and cheese) maintained a net weight of 15.0 oz., but the protein content dropped from 39 grams to 33 grams.
And while firms are reducing the quantity and quality of the food they sell, consumers are also choosing to purchase less food and even lower-quality food. The January 2023 report on consumer inflation sentiment shows that 69.4 percent of respondents “reduced quantity, quality or both in their grocery purchases due to price increases over the last 12 months.”
We have also seen a widespread and long-lasting change in customer service at restaurants. Many restaurants switched to providing only takeout for months or years. Even though the dine-in option has been reintroduced at some restaurants, the service hasn’t quite been the same, with QR-code menus, shorter hours, less staff, and terse demeanors.
It’s not surprising that the massive government interventions, including creating trillions of new dollars, would have countless effects—some that show up in various statistics but many that do not. For example, if we look back at the period of German hyperinflation, we see surprisingly boring data on food spending proportions (figure 2).
Figure 2: Household expenditures in Germany, 1920–22
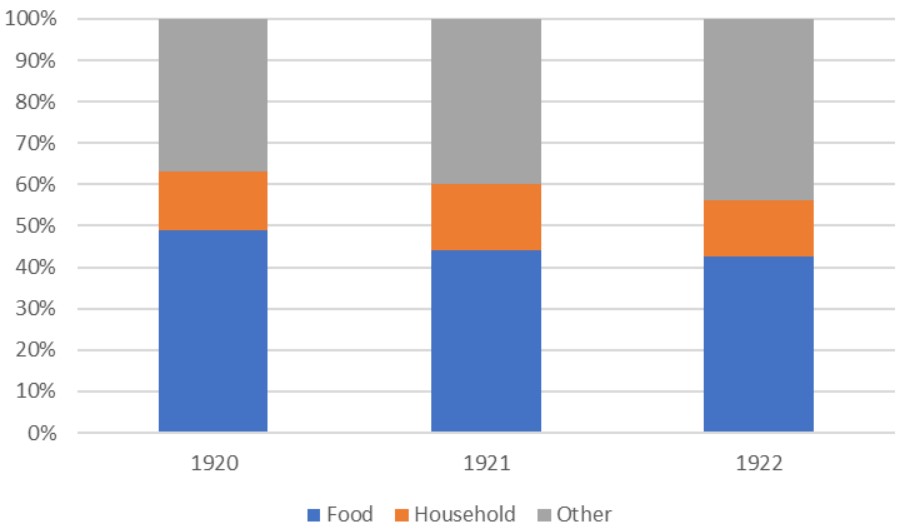
Source: Data from Carl-Ludwig Holtfrerich, The German Inflation, 1914–1923: Causes and Effects in International Perspective, trans. Theo Balderston (New York: Walter de Gruyter, 1986), cited in Gerald D. Feldman, The Great Disorder: Politics, Economics, and Society in the German Inflation 1914–1924 (New York: Oxford University Press, 1997), p. 549.
There wasn’t much change in expenditure proportions, despite prices soaring to absurd levels. The food price index over the same period increased 14,613 percent. All prices, not just food prices, were skyrocketing, so the expenditure proportions across categories remained relatively stable.
Historian Gerald D. Feldman commented on the German household expenditure data in a way that sounds familiar: “As one study after another pointed out, however, the full impact of these changes had to be understood in qualitative terms.” There was “reduced quality and quantity of the food consumed” and “poorer quality clothing,” among other qualitative changes.
Government statistics are unable to capture these subtleties. This should be obvious—your personal experience as a consumer is more than just the price you pay for a certain weight of food. We aren’t merely machines; we don’t describe our lives in miles per gallon or kilowatt hours.
This is why Ludwig von Mises attacked the conceited aggregates and indexes purported to measure various aspects of consumers’ lives: “The pretentious solemnity which statisticians and statistical bureaus display in computing indexes of purchasing power and cost of living is out of place. These index numbers are at best rather crude and inaccurate illustrations of changes which have occurred.”
He concludes: “A judicious housewife knows much more about price changes as far as they affect her own household than the statistical averages can tell.”
Source: Mises Institute
Dr. Jonathan Newman is a Fellow at the Mises Institute. He earned his PhD at Auburn University while a Research Fellow at the Mises Institute. He was the recipient of the 2021 Gary G. Schlarbaum Award to a Promising Young Scholar for Excellence in Research and Teaching. His research focuses on Austrian economics, inflation and business cycles, and the history of economic thought. He has taught courses on Macroeconomics and Quantitative Economics: Uses and Limitations in the Mises Graduate School.
Image: Pixabay
Become a Patron!
Or support us at SubscribeStar
Donate cryptocurrency HERE
Subscribe to Activist Post for truth, peace, and freedom news. Follow us on SoMee, Telegram, HIVE, Flote, Minds, MeWe, Twitter, Gab, and What Really Happened.
Provide, Protect and Profit from what’s coming! Get a free issue of Counter Markets today.
Be the first to comment on "Shrinkflation and Skimpflation Are Eating Our Lunch"