
 By Daniel Munch of Farm Bureau
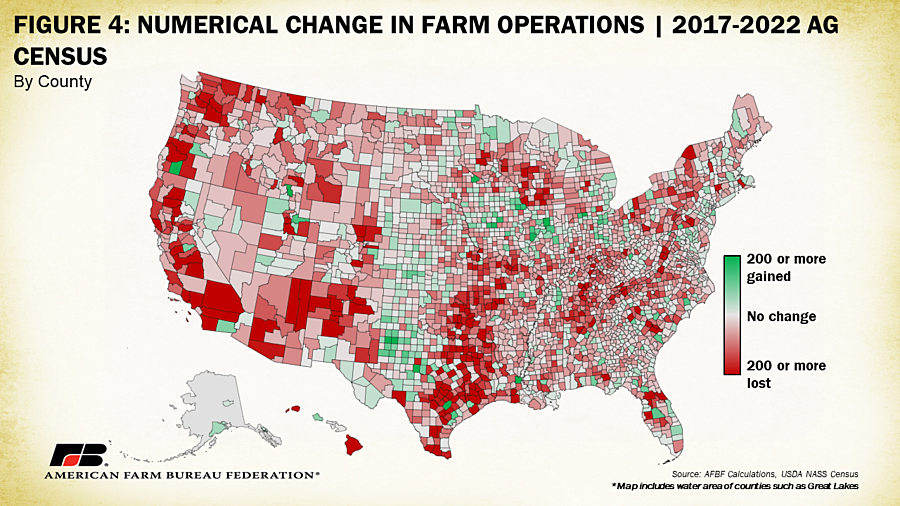
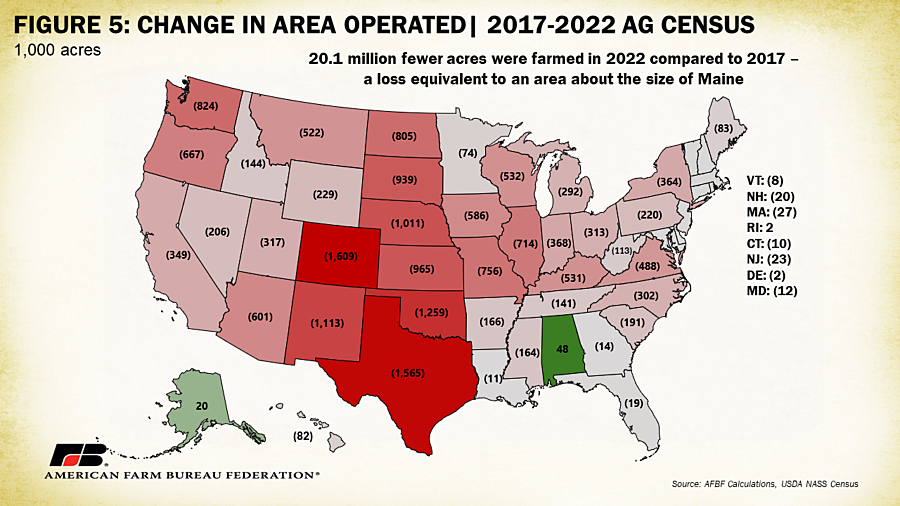
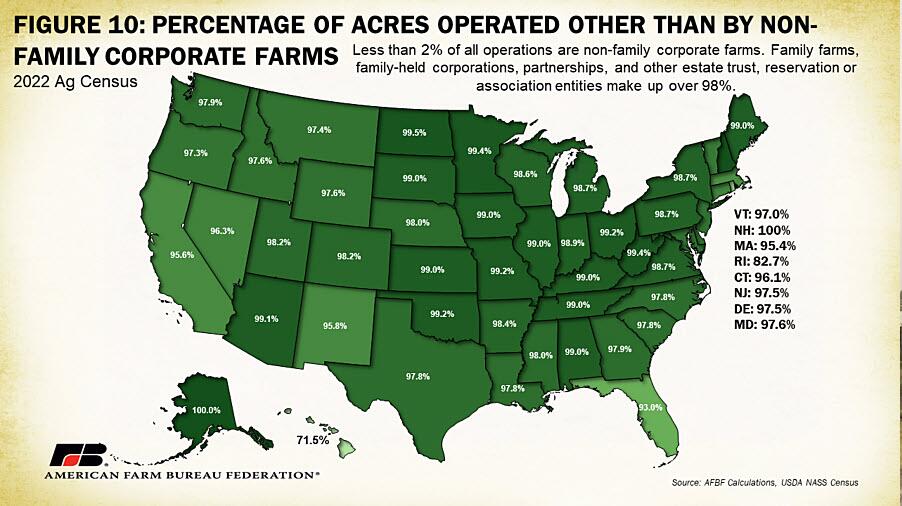
Between 2017 and 2022, the number of farms in the U.S. declined by 141,733 or 7%, according to USDA’s 2022 Census of Agriculture, released on Feb. 13. Acres operated by farm operations during the same timeframe declined by 20.1 million (2.2%), a loss equivalent to an area about the size of Maine. Only 1.88% of acres operated and 1% of farm operations were classified under a non-family corporate farm structure.
Conducted every five years, the Census of Agriculture collects data on land use and ownership, producer characteristics, production practices, income and expenditures. USDA defines a farm as an operation that produced and sold, or normally would have sold, $1,000 or more of agricultural products during the census year.
While the number of farm operations and acres operated declined, the value of agricultural production increased, rising from $389 billion in 2017 to $533 billion in 2022 (40% nominally and 17% adjusted for inflation). These updated numbers highlight the continuing trend of fewer operations farming fewer acres of land but producing more each year.
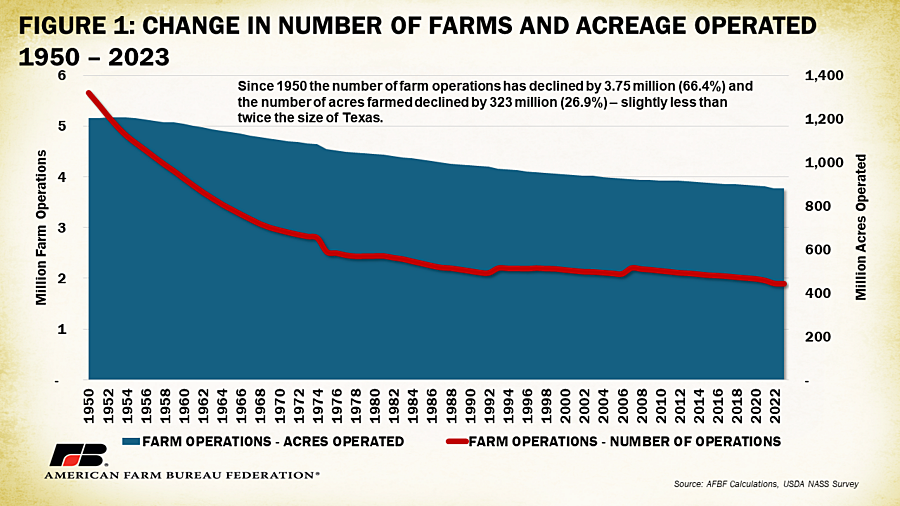
In addition to Ag Census data, USDA releases survey-based estimates on farm numbers once every year. Using this annual survey data dating back to 1950, the trend of fewer operations farming fewer acres becomes even more obvious. Since 1950, the number of farm operations has declined by 3.75 million (66%) and the number of acres farmed declined by 323 million (27%) – slightly less than twice the size of Texas. Technological advancements that have increased productivity, such as feed conversion ratios in livestock and yield per acre in crops, have allowed farmers and ranchers to produce more with less even as the U.S. population more than doubled, going from 159 million in 1950 to 340 million in 2023, and the global population more than tripled (2.5 billion to 8 billion) during the same period.
Farm Operations
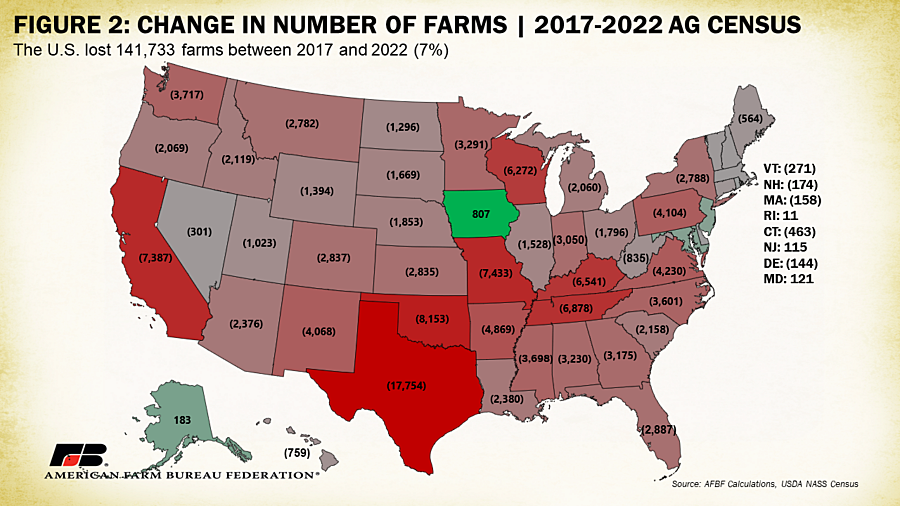
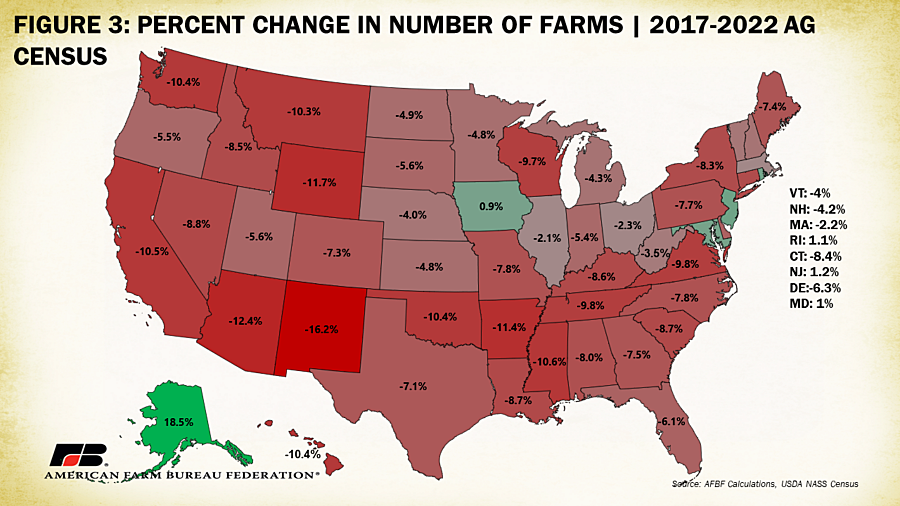
Between 2017 and 2022 all states but five (Alaska, Delaware, Iowa, Maryland, New Jersey and Rhode Island) lost farms. Texas had the largest numerical loss – nearly 18,000 farm operations – followed by Oklahoma (-8,153) and Missouri (-7,433). Iowa gained the most farm operations (+807) followed distantly by Alaska (+183). In terms of percentage loss of farm operations, New Mexico experienced the largest decline (-16.2%) followed by Arizona (-12.5%) and Wyoming (-11.7%). Alaska’s 183-farm gain was the largest percent increase at 18.5%. Though the presence of regional trends in farm operation losses appears limited, drought conditions that battered much of the West in 2021 and 2022 may be responsible, in part, for higher farm loss percentages in those states. Across states that gained farms, most were within the category of earning over $1 million in sales except in Alaska where the biggest gains were in farms earning between $5,000 and $50,000.
Area Operated
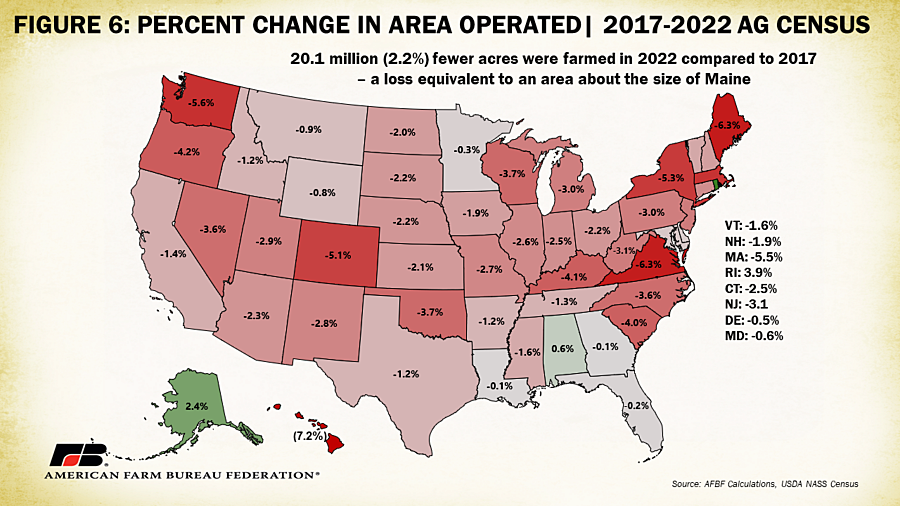
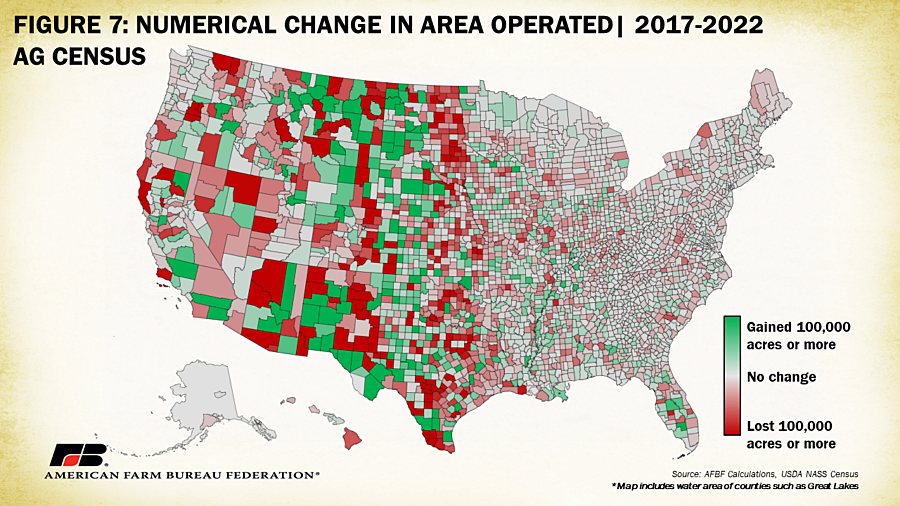
The 2022 census also indicates a decline of just over 20 million acres (2.2% of total) in acreage operated. Colorado led in terms of numerical decline, with 1.6 million fewer acres being farmed in 2022 compared to 2017, followed by Texas (-1.56 million), and Oklahoma (-1.26 million). Only three states, Alabama, Alaska and Rhode Island, had increases in operated area. By percent decline, the map of operated acreage looks quite different. Hawaii leads with a loss of 7.2% of operated area followed by Virginia and Maine both experiencing a loss of 6.3% and Washington experiencing a loss of 5.6% between 2017 and 2022. Counties in the West had the largest swings in acreage operated, likely linked to the sheer size of counties with a significant proportion of open and undeveloped land.
Even minor declines in farmed area can have a significant impact on the rural identity of states with smaller acreage and higher rates of commercial and residential development. The more land shifted out of agriculture production, the harder it is to return those acres to farming. Diminished production capacity within specific states and regions heightens dependence on purchases from other states or countries. For instance, Hawaii faces a unique situation with only enough production and food storage capacity to sustain itself for seven days, exacerbated by a 7% loss in actively farmed land over the past five years. In New England, on a weight basis, farmers produce only about 21% as much food as the states consume (with a portion of that going to outside buyers). Researchers have estimated that in order to reach 30% self-food-sufficiency, the six New England states would have to maximize the use of 401,000 existing underutilized acres and clear an additional 588,000 acres of land. Instead, acres operated in New England dropped by 145,000 between 2017 and 2022. Local regulatory dynamics, land use pressures and costs, and variations in cultural interests contribute to the shifting landscape of farming, often pushing it farther away from population centers.
Economic Class
New Ag Census data also allows analyses of farm numbers and area operated by economic class and the market value of agricultural products sold. Economic sales classes are defined by summing the sales of agricultural products and government program payments; and the market value of agricultural products sold represents the gross market value before taxes and production expenses of all agricultural products sold or removed from an operation in 2022. Between 2017 and 2022 the number of farms in the $0 – $4,999 economic class dropped the most, by 120,970 (13%), followed by the $5,000 – $49,000 category, which lost 32,215 operations (5%). The category of farms in an economic class over a million grew by 28,566 operations (36%). The number of farms in lower economic classes shrunk at a faster rate than those in higher economic classes. That said, most ag production is generated by farms in higher economic classes. In 2017, 69% of the value of agricultural products sold was products by farms in the million-dollar-plus economic class. In 2022 this increased to 79% (Figure 8).
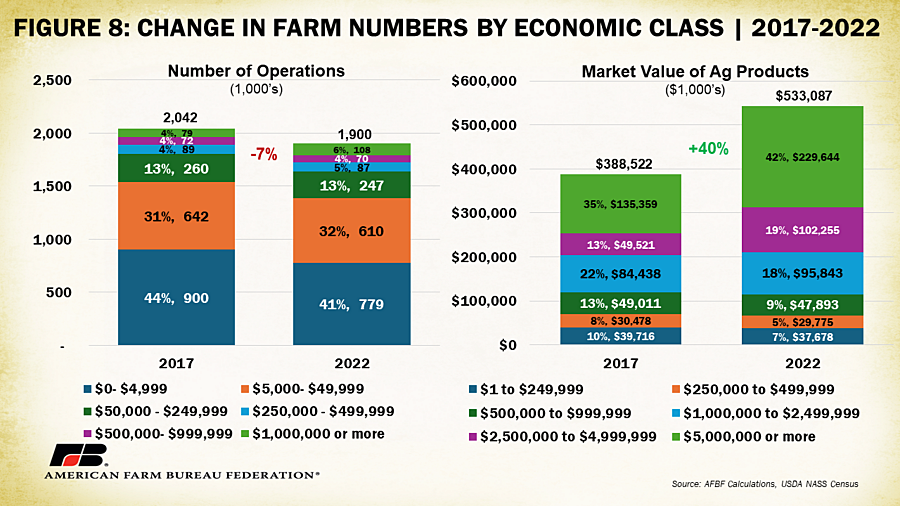
Farmers and ranchers currently face the highest production expenses on record, in addition to increasingly complex local, state and federal regulations and growing competition from lower-cost foreign markets. These dynamics shrink margins for producers and often more significantly impact farms in lower economic classes. Farms that are able often expand in size to capitalize on economies of scale, a concept rooted in the efficiency often gained as production increases. Larger farms can benefit from reduced per-unit costs due to bulk input purchasing, streamlined operations and enhanced bargaining power with suppliers. Mechanization and modern technology, which often come with substantial upfront costs, are more economically justifiable for larger operations, further boosting productivity. Unsurprisingly, the latest census data underscores that farms making such investments tend to fare better. Notably, farms in the $0 -$4,999 and $5,000 -$49,999 economic classes, constituting over 70% of total farms, often rely on alternative income sources. Those in the $0 – $4,999 economic class, especially, are more likely to be operations participating in agriculture for leisure or personal interest as opposed to income reliance. Declines in operations in these categories may be linked to the cost associated with supporting a side business that may no longer be sustainable but has limited impacts on total domestic food production.
Farm Typology
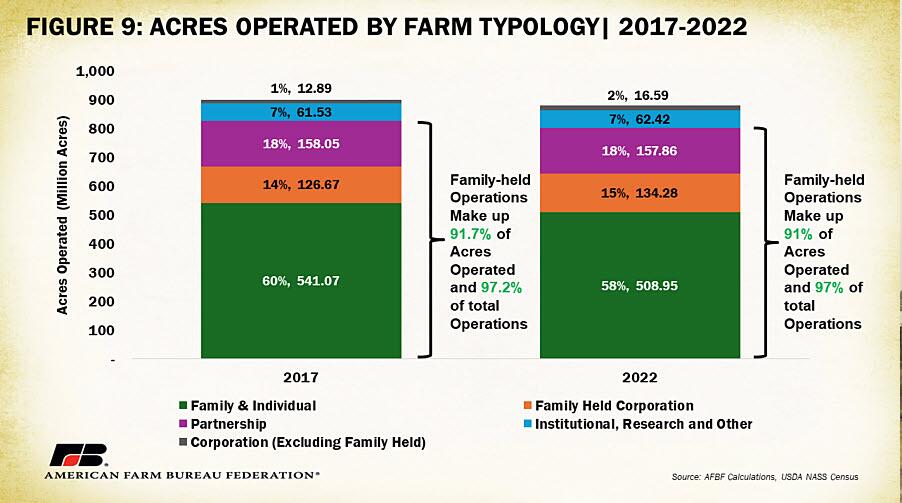
USDA also reports the number of farms and acres operated by farm type. This section of the report captures the different ownership structures of farming operations and includes: family-held corporations, family and individual filings, partnerships, corporations (excluding family held) and “other” which includes institutional, research, reservations and other owner entities. Family and individual filings, partnerships and family-held corporations represented 97% (1.884 million) of all farms in 2022 (down from 97.2% in 2017). Corporations other than family held made up 1% (18,960) of all farms and the “other” category made up the remaining 2.2% (37,480) farms.
Analyzing in terms of acreage managed by these operation types provides a better understanding of the proportion of agricultural production in the category. In 2022, family and individual filings, partnerships and family-held corporations represented 91% (801 million) of all acres operated in the U.S. Family and individual filings represented 58% of operated acreage alone (down slightly from 60% in 2017). Non-family-held corporations represented 2% (16.6 million) of acreage operated, up from 1.4% in 2017. “Other” entities operated 7.1% (62.4 million) of acres in 2022, much of which was concentrated in Western states with substantial land in American Indian reservations. The overwhelming majority of farmland in the U.S. continues to be operated by family-based ownership structures. By state, Hawaii had the highest percentage of acres operated by non-family-held corporations (28.5%), followed by Rhode Island (17.3%) and Florida (7%). In Alaska and New Hampshire no farm acreage was managed by non-family-held corporations.
Conclusion
The 2022 Census of Agriculture provides an in-depth look at the U.S. farm landscape over the past five years. With a loss of 141,733 farm operations, representing a 7% decline, and reduction of 20.1 million acres under cultivation, equivalent to the size of Maine, the agriculture sector has faced significant shifts. Though the data shows an ongoing consolidation of farms into fewer, larger operations, it also highlights the adaptability of farmers and ranchers. Despite fewer farms and reduced acreage, the value of agricultural production has increased by 40% (17% in inflation-adjusted dollars), reaching $543 billion in 2022. This increase in productivity underscores the impact of technological advancements and efficiency gains, allowing farmers to produce more with fewer resources. The magnitude of changes is not uniform across states, with the Southwest experiencing a much higher percentage loss in farms than states east of the Mississippi. The challenges faced by farms of all sizes has raised calls for a robust and comprehensive farm bill that could provide support to the operations most at risk and to those providing the lion’s share of the American food supply, helping both to navigate economic uncertainties and regulatory complexities, to undertake innovative and sustainable practices, and to promote the long-term viability of a diverse agricultural landscape across the nation. The Census of Agriculture paints the picture of what we have lost, and of what more could be lost without firm support.
Sourced from ZeroHedge
Become a Patron!
Or support us at SubscribeStar
Donate cryptocurrency HERE
Subscribe to Activist Post for truth, peace, and freedom news. Follow us on SoMee, Telegram, HIVE, Minds, MeWe, Twitter – X, Gab, and What Really Happened.
Provide, Protect and Profit from what’s coming! Get a free issue of Counter Markets today.