
Preamble
The natural home for this work is a biomedical journal. There is zero chance, however, that a paper would be accepted by any conventional journal. Why? Because the results are earthshaking, as stated in the title.
This post is technical, but the preamble is not. For the non-academic reader, the preamble will serve two purposes: 1) to share an interesting story about the evolution of this work; 2) to give a simple summary of what I found.
So, stay with me at least through this section.

Although I have over 200 scientific publications, only a few were truly innovative in the sense of a creative idea that led to an interesting discovery. Most were uninspiring, “normal” science. I often wondered how those rare cases were born, and in retrospect, it was never prolonged thinking. Rather, it was an unexplained spark, a moment when an idea came into my mind out of the blue, or some loose ends got connected. This work had something of both.
I never trusted the results of the Pfizer trial. That 95% effectiveness against a respiratory virus was too good to be true — unprecedented in the context of a viral respiratory infection. I could not tell, however, what might have gone wrong.
Working on a recent post, I concluded that the culprit must have been the ascertainment of cases. For whatever reason, many cases have been missed in the vaccine arm, and therefore, the original results cannot be trusted. Is there any other way to estimate the true effectiveness against symptomatic infection from the trial’s data? “Probably not” is the expected answer.
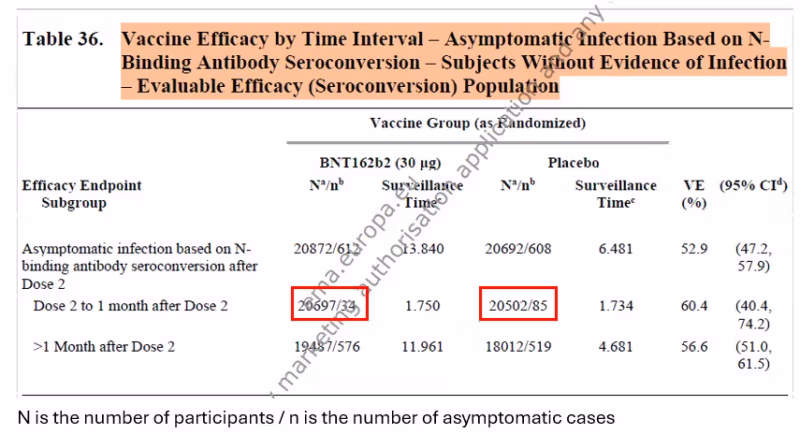
Coincidentally, I discovered another document on the Pfizer trial, titled “Final Full Clinical Study Report.” In that lengthy document, Pfizer included estimates of the effectiveness against asymptomatic infection, which were based on a blood test in all participants (anti-N antibodies).
Is there a way to estimate the effectiveness against symptomatic infection from the effectiveness against asymptomatic infection?
That was the spark: posing a question that linked two loose ends. Answering it was not too difficult. Simple computational work.
Every analysis is based on some premises or assumptions. Here, I needed two:
First, I assumed that the vaccine does not prevent an infection. It may only prevent symptoms when infected. This premise is widely accepted now, and I was able to demonstrate it indirectly in the trial’s data.
My second assumption had to do with the split of infections between asymptomatic and symptomatic. There are data on the topic, including data I was able to extract from the trial.
The rest of the work was no more than a simple equation I borrowed from an old paper and a few rows on an Excel file, which I will show at the end.
I promised a spoiler:
Of over half a dozen different computations, one resulted in zero effectiveness, one in 50%, and all others — up to 25%. We should follow the majority: it was no more than 25%. And that’s before waning…
Sources of Data
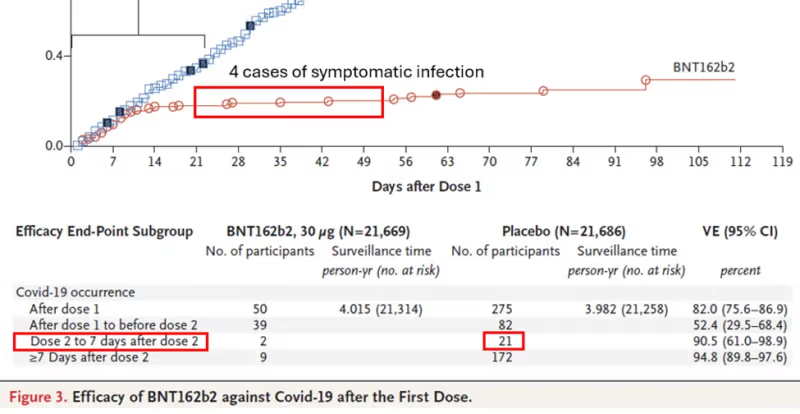
To combine data on asymptomatic infections and symptomatic infections, I needed to find a relevant time window in which both types of data were available. It was between dose 2 (administered 21 days after dose 1) and one month later, a period for which the reported effectiveness was between 90.5% and 94.8%.
There were two sources for the data: the famous paper in the New England Journal of Medicine and the Pfizer document I mentioned in the preamble, which was presumably submitted to the FDA. Below you will find screenshots of the data I used. Red rectangles were added.
Preliminary Analysis
The starting table is simple: the number of cases of symptomatic infection and asymptomatic infection in the two arms of the trial within one month after the second dose.
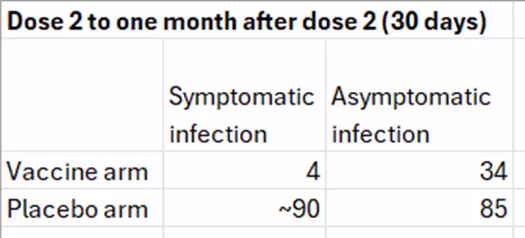
The numbers in the right column were transcribed from table 36 above. The number 4 is based on the graph, and the number 90 was estimated from the table below the graph: 21 cases in 7 days between dose 2 and day 6 (day 7 belongs to the next category). That’s 3 cases per day and 90 cases in 30 days. We get a similar estimate by relying on 275 cases in about 100 days, given a constant slope.
The frequency of asymptomatic infections in the placebo arm is about 50%, which is reasonable. Estimates in the literature range from one-third to one-half of all infections. Both 50% and 30% will be used later in the computation.
As will be explained shortly, the number in the right upper cell (34) is wrong, but I will use the table to compute risk ratios (RR) and odds ratios (OR) to illustrate several basic points.
Risk is interpreted as probability, which is estimated by a proportion. Odds are formally defined as the ratio of complementary probabilities (e.g., 0.514/0.486 below) but may be computed as the ratio of one event to the complementary event (e.g., the odds of symptomatic infection in the placebo arm are 90/85).
The table and the bullet points below refer to people who were infected.
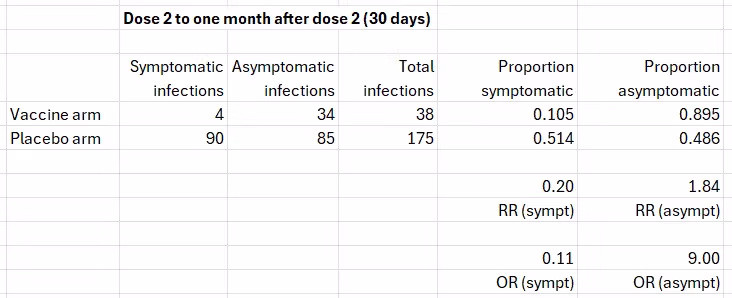
- If vaccination reduces the probability of symptomatic infection (RR=0.20; effectiveness=80%), it must increase the probability of asymptomatic infection (“RR”=1.84; effectiveness=-84%). A negative effectiveness here is obviously a positive result. By analogy, if a treatment reduces the case-fatality of a disease, it increases the survival of patients.
- The RR of symptomatic infection (0.20) is NOT the inverse of the “RR” of asymptomatic infection (1/1.84=0.54). That’s a generic statistical phenomenon.
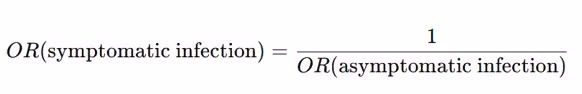
- In contrast, the OR of symptomatic infection (0.11) is the inverse of the OR of asymptomatic infection (1/9=0.11). That’s also a generic phenomenon, which is going to be helpful.
Notice that for either outcome, the odds ratio is farther from the null than the risk ratio: 0.11<0.20<1 and 9.00>1.84>1. That’s a well-known relationship.
I devoted a recent post to the data on asymptomatic infections in the Pfizer trial. In brief, the estimates they reported (table 36 above), 50% to 60% effectiveness, are wrong because the blood test misses many more infections post vaccination than infections in the unvaccinated. Based on data from two studies — one reporting on the Pfizer vaccine and another on the Moderna vaccine — the true percentage of post-vaccination infections is two to three times the percentage that show seroconversion. Applying three correction factors from that range to the upper cell (bold print), we get the following results for symptomatic infection.
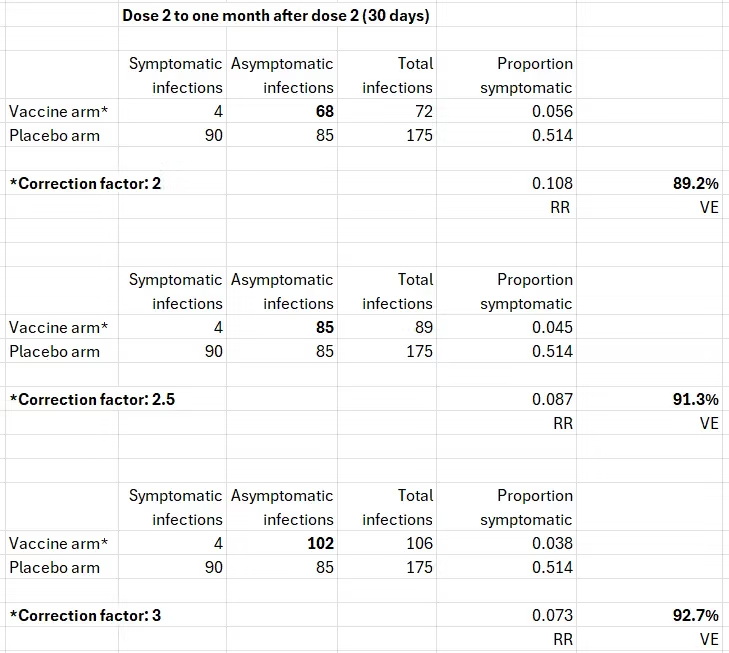
After correcting the number of asymptomatic infections in the vaccine arm, the estimates of effectiveness against symptomatic infection — in infected people — are in agreement with the reported results one month after dose 2: between 90% and 95%. That’s reassuring.
Most importantly, the similarity of the estimates in infected participants to the estimates in all participants supports the first assumption. All of the effects on symptomatic infection as reported from the trial, correctly or incorrectly, were due to preventing symptoms when infected. The vaccine did not prevent infections. Unbeknownst before, the trial has actually estimated the effect on symptoms when infected.
Estimating the True Effectiveness against Symptomatic Infection
The results of the trial, and of my concurring analysis above, assume correct counting of symptomatic cases in the vaccine arm. If that number (e.g., 4 above) cannot be trusted, neither set of results is valid.
Can we bypass the need to rely on that number? Can we get RR (symptomatic infection) from RR (asymptomatic infection)? We already know how to get a corrected range for the latter.
As explained earlier, we cannot just take the inverse of the risk ratio because

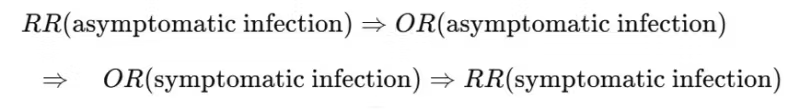
But the following equality holds for the odds ratio.
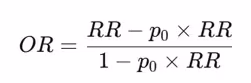
The risk ratio and the odds ratio are not equal (unless they are 1). However, there is a non-linear function that connects them.
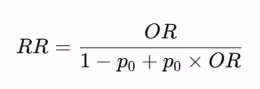
Which can be rearranged to compute the odds ratio from the risk ratio if needed.
p0 is the “baseline risk.” In our case, it is either the probability of asymptomatic infection or the probability of symptomatic infection in the unvaccinated (the placebo arm), depending on which outcome is of interest.
So, we have a computational trail from the risk ratio of asymptomatic infection to the risk ratio of symptomatic infection that does not rely on correct counting of symptomatic infections in the vaccine arm.
Sensitivity Analysis
As previously shown (table 36), the reported effectiveness against asymptomatic infection was 50% to 60%, which means a risk ratio between 0.4 and 0.5. I used 0.5. The results are worse (lower effectiveness against symptomatic infection) when the risk ratio is 0.4, so I show only one example, the best result.
My sensitivity analysis included two varying factors:
- Three correction factors (2, 2.5, 3) of the risk ratio of asymptomatic infection to account for under-detection of post-vaccination infections by the anti-N-antibody blood test. A reported (biased) risk ratio of 0.5 is corrected to 1, 1.25, and 1.5, respectively. Vaccination either has no effect or it increases the “risk” (probability) of asymptomatic infection.
- Two proportions of an asymptomatic infection: 0.5, as observed in the data, and 0.3, the lower bound in the literature.
These are the results (vaccine effectiveness in bold print).
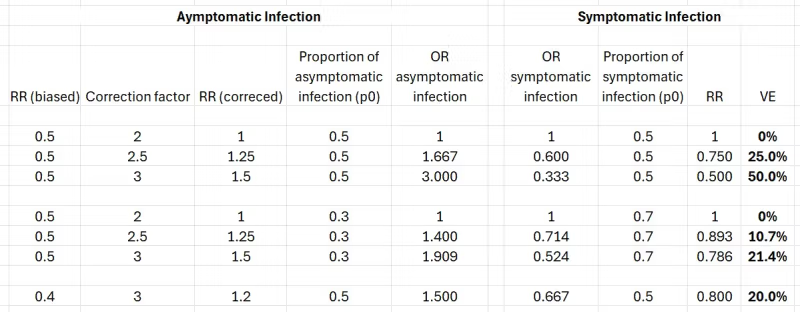
If the corrected risk ratio of asymptomatic infection is 1, the computation is redundant. The vaccine has no effect on either kind of infection, regardless of the proportion of asymptomatic infections.
Otherwise, to illustrate the steps, consider the second row. A biased risk ratio of asymptomatic infection (0.5), as reported by Pfizer, is corrected to 1.25. Assuming 50% of the infections are asymptomatic (p0=0.5 in the conversion equation), we get an odds ratio of 1.667. Taking the inverse, we get the odds ratio of symptomatic infection (0.6). Converting that odds ratio to a risk ratio, we get 0.75, which is 25% effectiveness against symptomatic infection.
The results speak for themselves. One exception aside, they are closer to zero than to 95%.
Epilogue
Are the results valid? I think they are, of course.
Might I be wrong? Nobody is never wrong. However, someone will have to show me where I am wrong along the analysis trail, and that’s unlikely to happen. Will this post even elicit a response from the opposite side? For most people, including scientists, questioning an old trial is a storm in a teacup. (They forget that there is no expiration date for seeking the truth.)
But maybe a miracle will happen. Maybe officials at the NIH or the FDA will read this post, judge the validity of the results, and ask a few methodologists to review it. If the results are not challenged, they will submit my analysis and those reviews to Pfizer, request a response, and put everything in the public domain.
May I borrow a famous sentence?
I have a dream.
Acknowledgment
I thank Tomas Fürst for comments on a draft post.
Republished from Medium


