

In 2021, we saw the unwinding of a number of policies and practices put in place in 2020, as well as the reversal of certain trends. Even as some states cast off lockdowns, compulsory masking, and other pandemic policies, others lifted and reapplied stringent measures time and time again. Even in the last weeks of the year there remained some policymakers acting as if it were February 2020. Political rifts in American society seem as deep and divisive as they’ve been in the living memory.
Inflation is back, the current administration is being pilloried in polls, transportation snarls are everywhere, Russian troops are poised to invade a neighboring country, and in retrospect 2021 looks more and more like 1979.
Here, in my sole estimation, are 21 noteworthy data points–prices, percentages, dates and other forms of quantitative information–that highlight or exemplify certain developments in 2021, the second year of the pandemic.
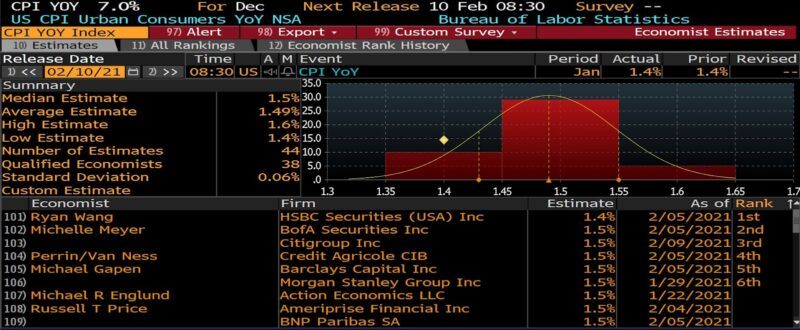
- 1.4%
The year began with the Bureau of Labor Statistics January 2021 US CPI (Urban Consumers Index, YoY) reading coming in at 1.4 percent (below consensus estimates of 1.5 percent) on February 10, 2021.
- 680 Percent
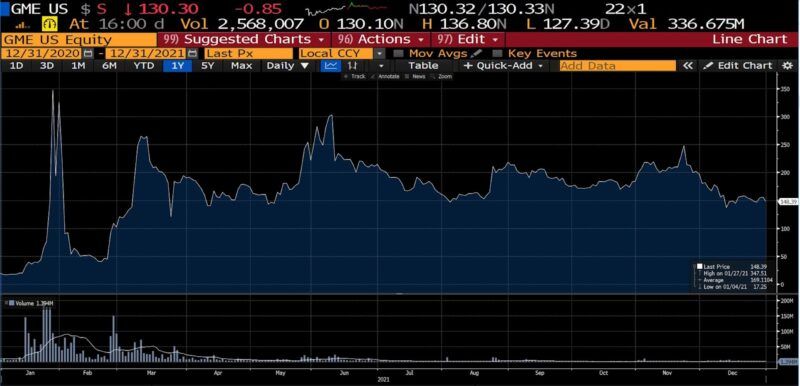
The publicly traded stock of GameStop, the video game retailer, increased by this amount in January of 2021. Despite questionable financials, groups of retail traders coordinated a short squeeze which caught many hedge funds in the low-liquidity stock by surprise. While the media played up egalitarian angles, on both the long and short side the event exemplified the distortion of sound risk management following policy-induced market volatility and effectively zero interest rates.
By various accounts the Shiba Inu coin increased by one of these amounts–in millions of percent–in 2021 before collapsing in price. At one point an $8,000 investment became worth several billion dollars…if a counterparty could be found to sell to.
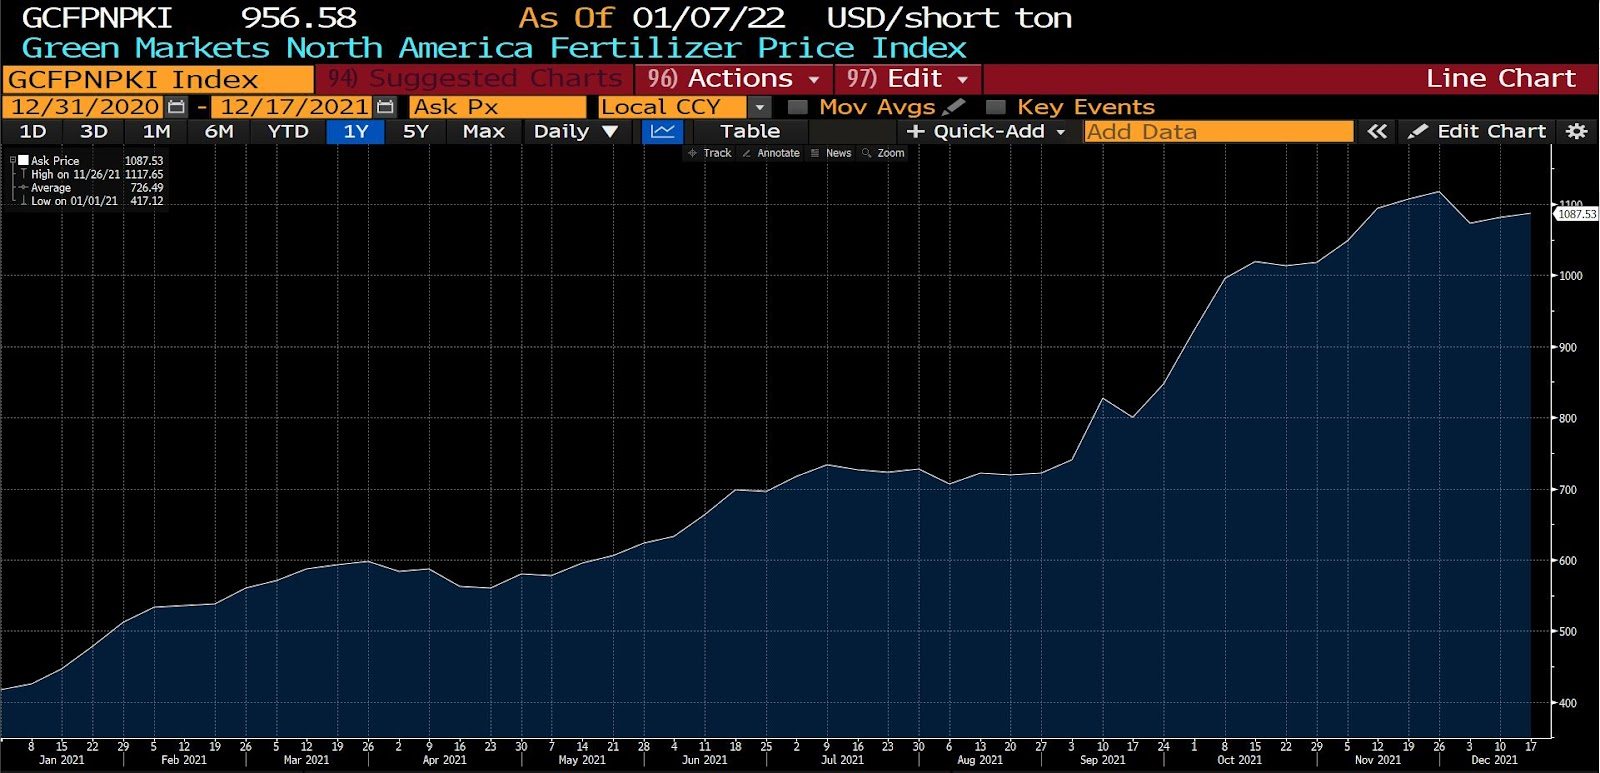
- 160.72 Percent
Shortages of chemicals and increases in natural gas prices led to a jump in fertilizer prices, as the 2021 increase in the Green Markets North America Fertilizer Price Index depicts. Scarcity of ammonia, urea, potash, sulfur, and a wide variety of other fertilizers throughout last year have led farmers to both shift toward less fertilizer-intensive crops as well as reducing overall harvest sizes.
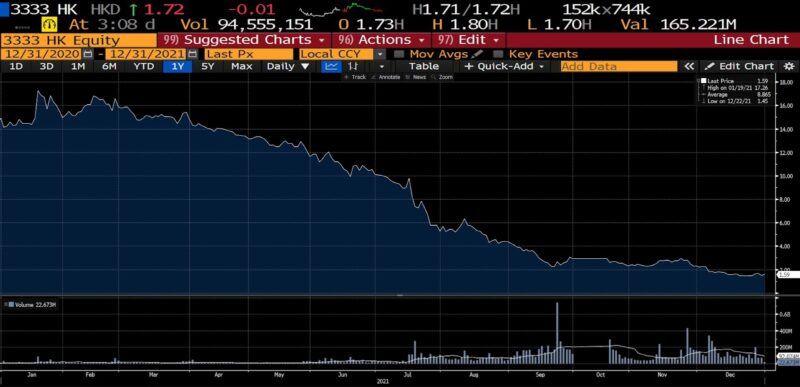
- –88.75 Percent
Loss in China Evergrande Group common shares in 2021. The conglomerate, owing to highly leveraged investments in real estate, fell from a high of $17.26 in mid-January to a low of $1.45 in mid-December.
- $1.25 and $1.15
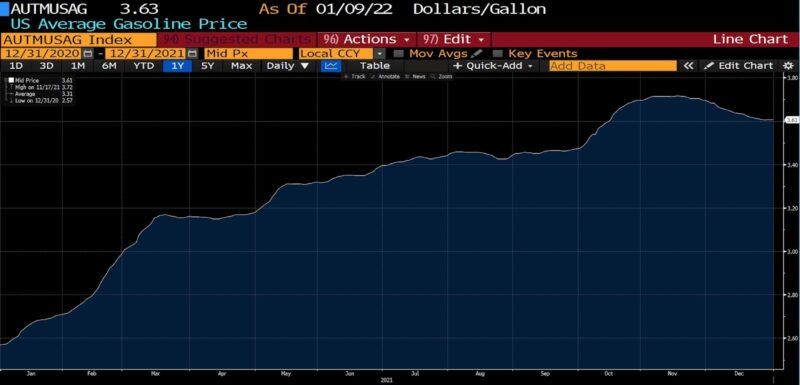
The price to which many formerly $1.00 goods at Dollar Tree and Dollar General have risen, as well as many 99 Cent Pizza places in New York City in 2021. And the low-to-high change in the US Average Gasoline Price (from $2.57/gallon to a high of $3.72/gallon) during the year.
- 2.97 Percent (297 basis points)
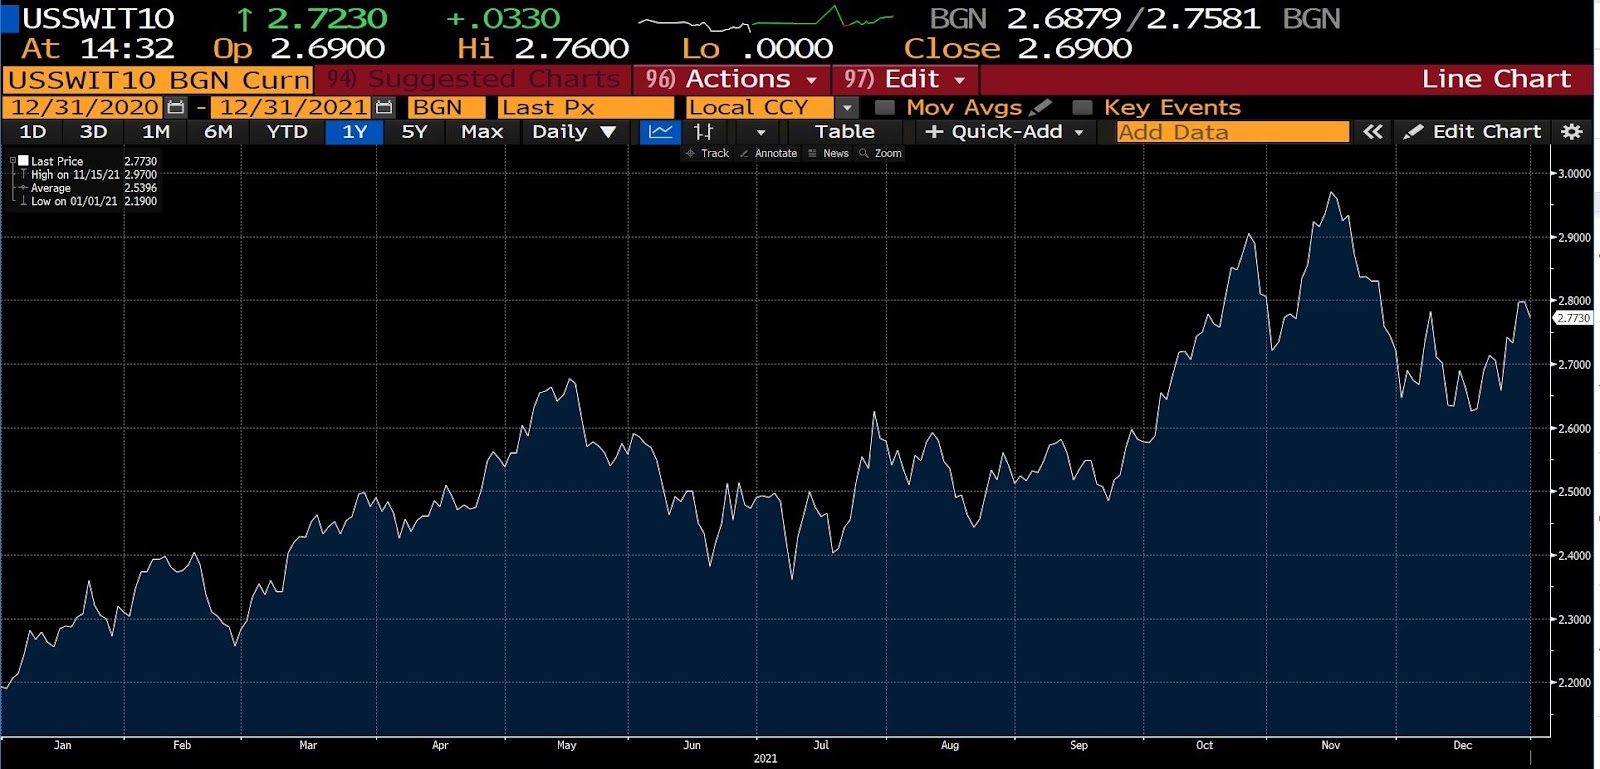
The highest 2021 value of the 10-year zero coupon US inflation swap, predicting an average annual inflation of nearly 3 percent over the next ten years.
- 39 Percent and 38 Percent
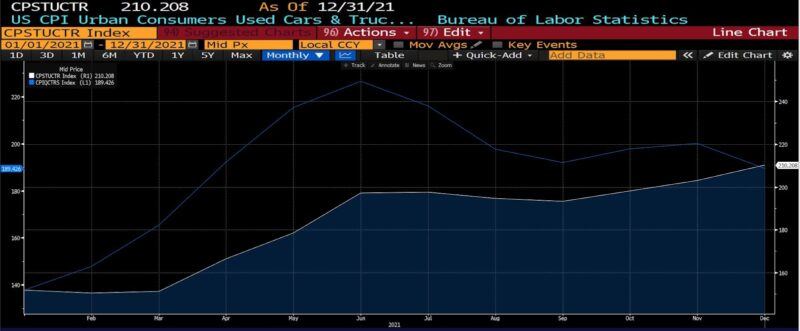
Owing to semiconductor shortages, shipping/transportation delays, and stimulus payments, used (meaning, completed/available) and rental car prices shot up in 2021. By the end of 2021, the CPI index that accounts for used cars and trucks had risen 39 percent, while the rental index rose 38 percent. (Rental prices had come down from being up as much as 64 percent by June 2021.)
- $6,326
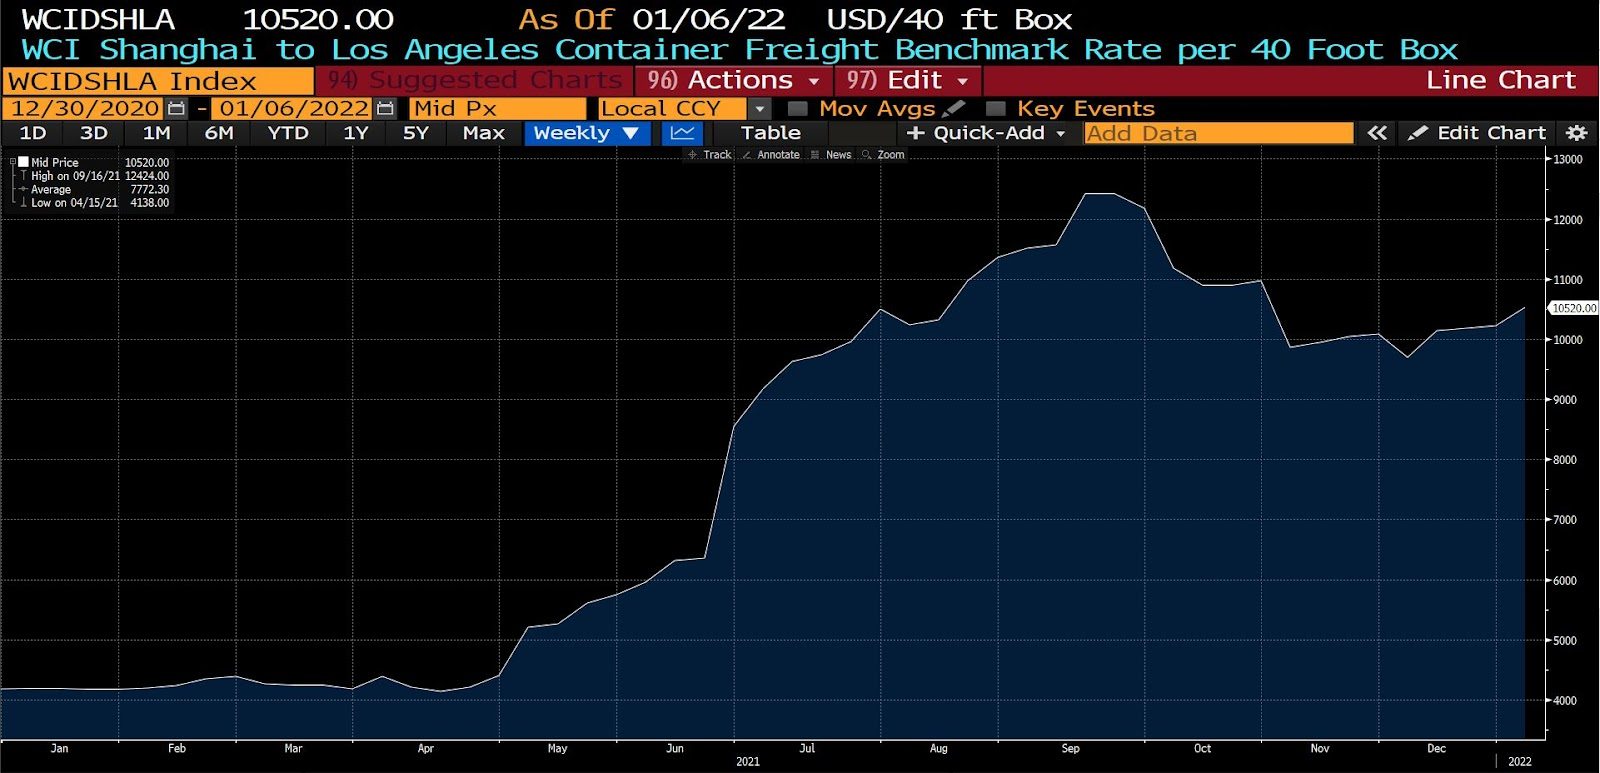
Between January 2021 ($4,194) and December 2021 ($10,520), the increased cost of sending a 40-foot container from Shanghai to Los Angeles per WCI.
- 2, 2, and 1
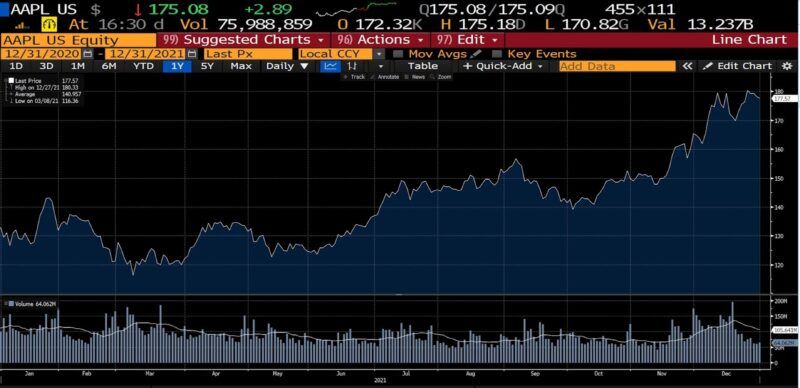
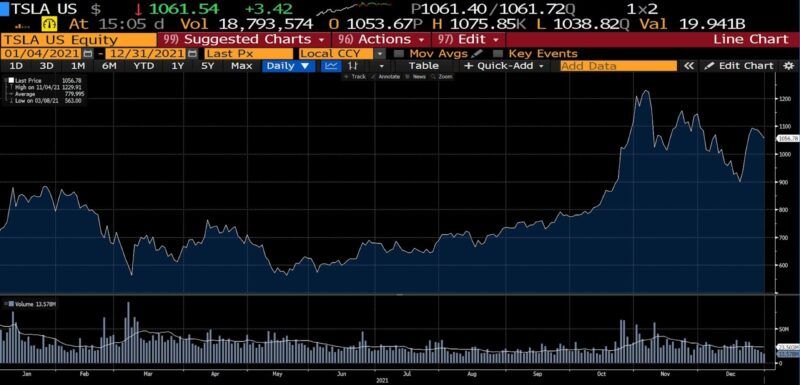
The number of US publicly-traded firms which, respectively, surpassed $1 trillion (Tesla and Facebook/Meta), $2 trillion (Microsoft and Alphabet), and $3 trillion (Apple) in market capitalization in 2021.
At a $3T market cap, Apple alone was worth more than AT&T, Boeing, Coca-Cola, Comcast, Disney, Exxon Mobil, Ford, Goldman Sachs, IBM, McDonald’s, Morgan Stanley, Netflix, Nike, and Walmart combined.
- $335 Billion
Peak net worth of innovator Elon Musk, reached in early November 2021 upon the announcement that Hertz would purchase 100,000 electric vehicles from Musk’s Tesla Corporation.
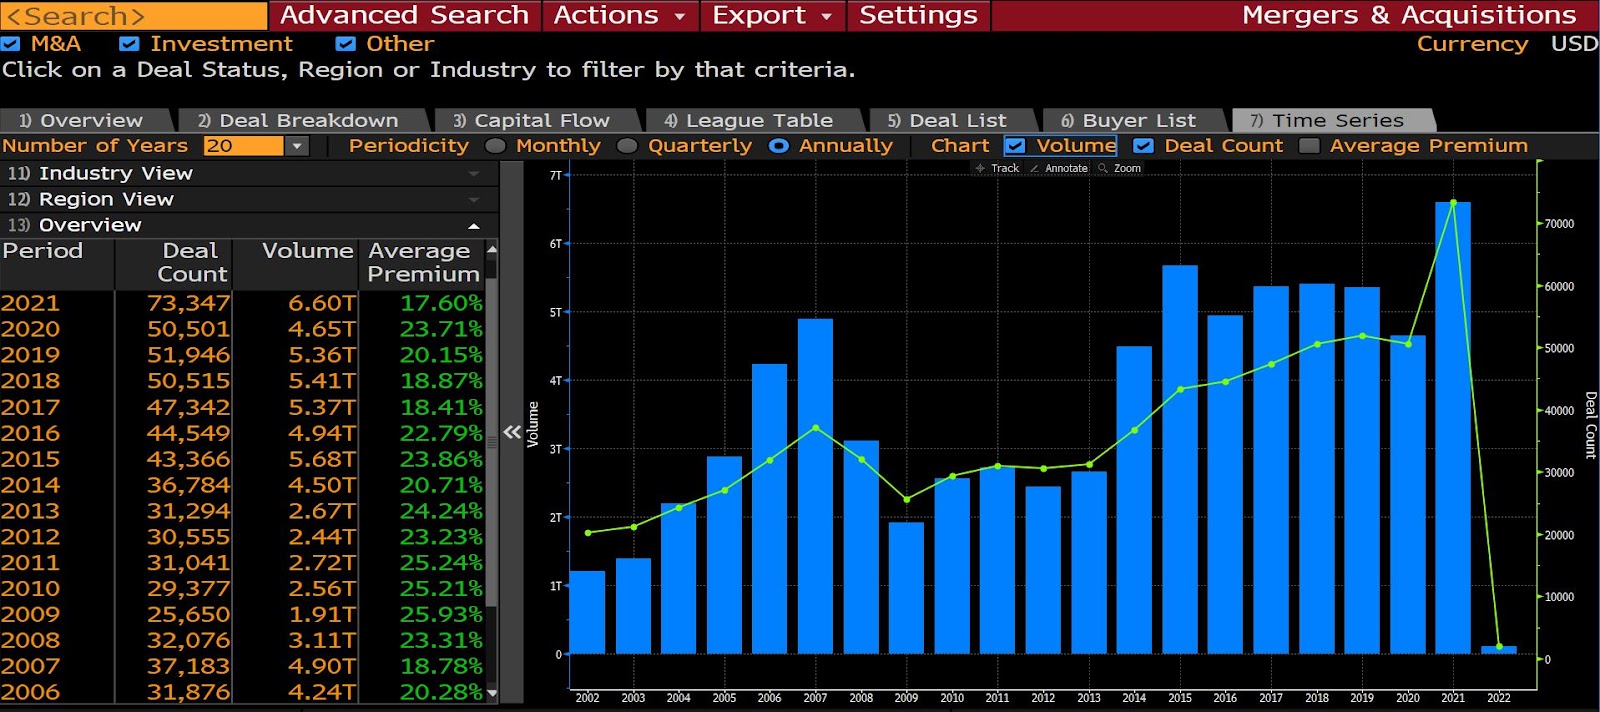
- 61,193
Number of acquisitions, mergers, and other major corporate transactions struck in 2021 accounting for $5.8 trillion worth of deals. It’s an all-time record, it’s the first time the total value surpassed $5 trillion, and the continuation of a trend that has roots in low interest rates, rising asset prices, and the decimation of small/medium-sized firms owing to lockdowns and stay-at-home orders. (Note: Bloomberg data employs a different count methodology.)
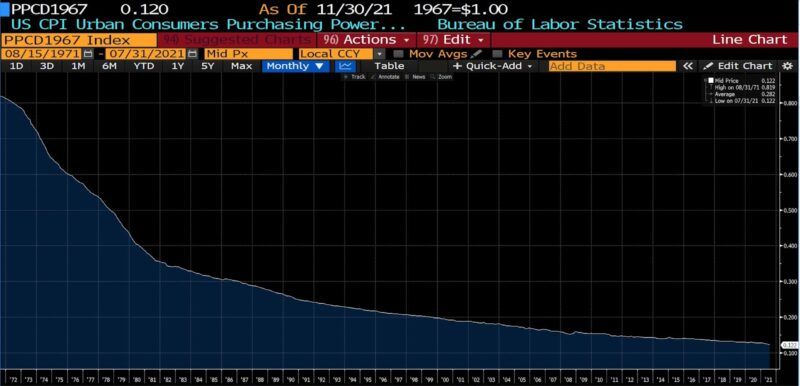
- 50
On August 15, 2021, it was exactly 50 years to the day since President Richard M. Nixon closed the gold window and with it the last tie between the US dollar and gold. Although there are a number of estimates, by one measure the dollar has lost 85 percent of its purchasing power since then.
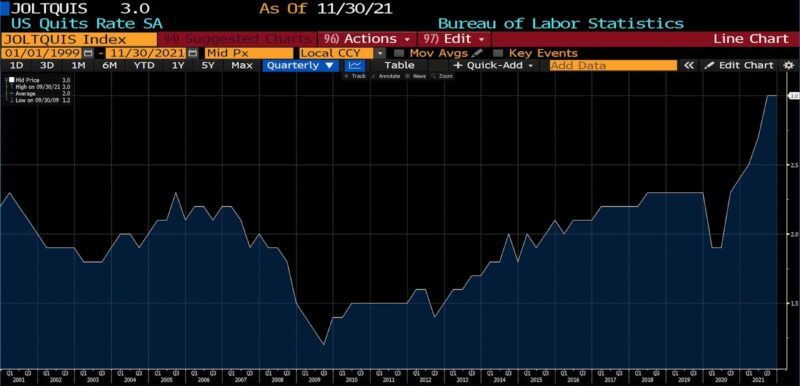
- 4.5 million
In the November 2021 Job Opening and Labor Turnover Summary of the US Bureau of Labor Statistics reported 4.5 million quits: 3.0 percent, a record going back decades. The industries seeing the largest number of voluntary departures included food services, accomodations, hospitality, healthcare, transportation, warehousing, and utilities. The regions most affected are the Northeast, the Midwest, and the South.
- 2
The number of Federal Reserve officials to resign after it was revealed that they traded in brokerage accounts before policy announcements. Robert Kaplan (President of the Dallas Fed) and Eric Rosengren (President of the Boston Fed) left their offices in 2021 after disclosures regarding the timing of certain investment decisions.
Federal Reserve Vice Chair Richard Clarida resigned following similar revelations in January 2022.
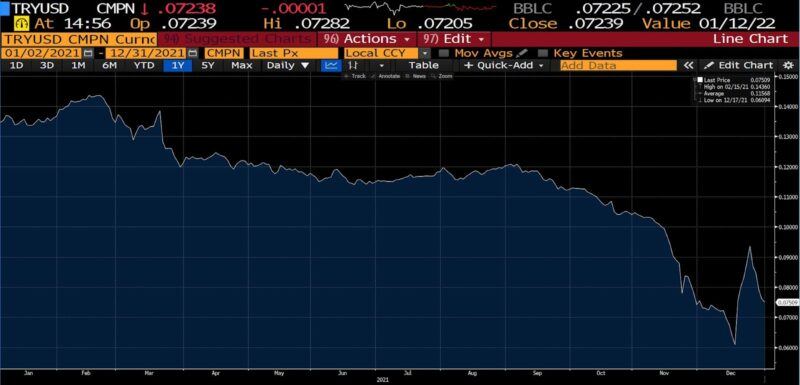
- -44 Percent
Loss of value of Turkish lira vs the US dollar in 2021 amid economic mismanagement and a 36 percent rate of inflation (annualized).
- 15 June 2021
Date of acceptance of an article entitled “Inter-Hospital Escalation-of-Care Referrals for Severe Alcohol-Related Liver Disease with Recent Drinking During the COVID-19 Pandemic” in the journal Alcohol and Alcoholism. In the coming years, this article will likely appear as an early, canary-in-the-coal-mine warning about one consequence of lockdowns.
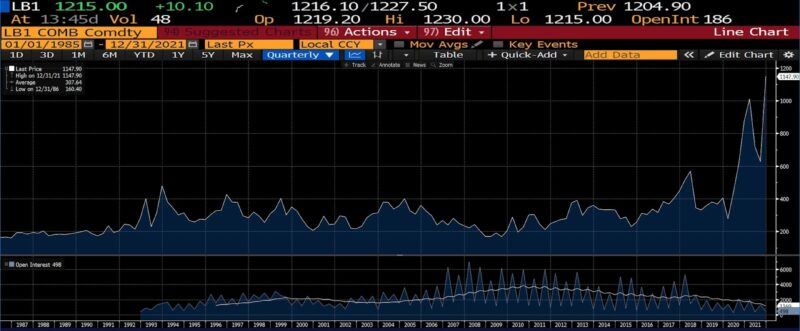
- 10
Lumber was a commodity of particular focus throughout 2021, driven by a combination of pandemic-policy shutdowns, stimulus payments, an explosion of DIY projects, and tariffs. At one point, because so much panic buying had taken place as prices rose from $400 to $1,700 per thousand board-feet, inventories of major lumber yards, wholesalers, contractors, and homebuilders were full. Ten is the number of times in 2021 that front-month lumber futures crossed over or under the $1,000 per thousand board-feet price in 2021, after trading at an average price of $291.31 per thousand board-feet for over three decades.
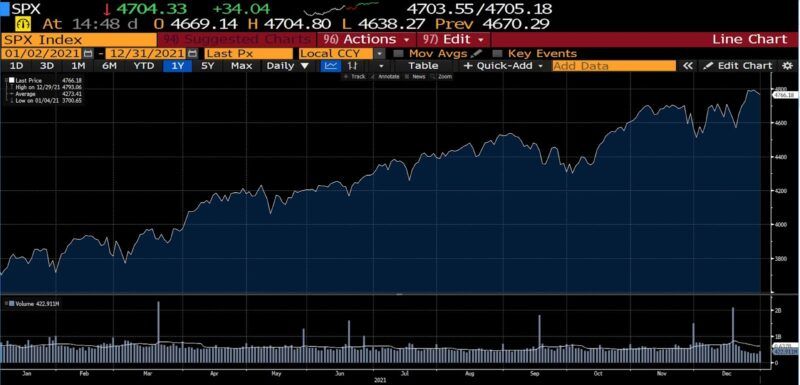
The number of new highs hit by the S&P 500 in 2021 as it notched a 26.9 percent return. (Going back several decades, the average number of new highs hit per year is 18, a record only beaten in 1995 at the start of the dot-com era.) Among other indices, the Dow Jones Industrial Average returned 18.7 percent and the Nasdaq Composite 21.4 percent.
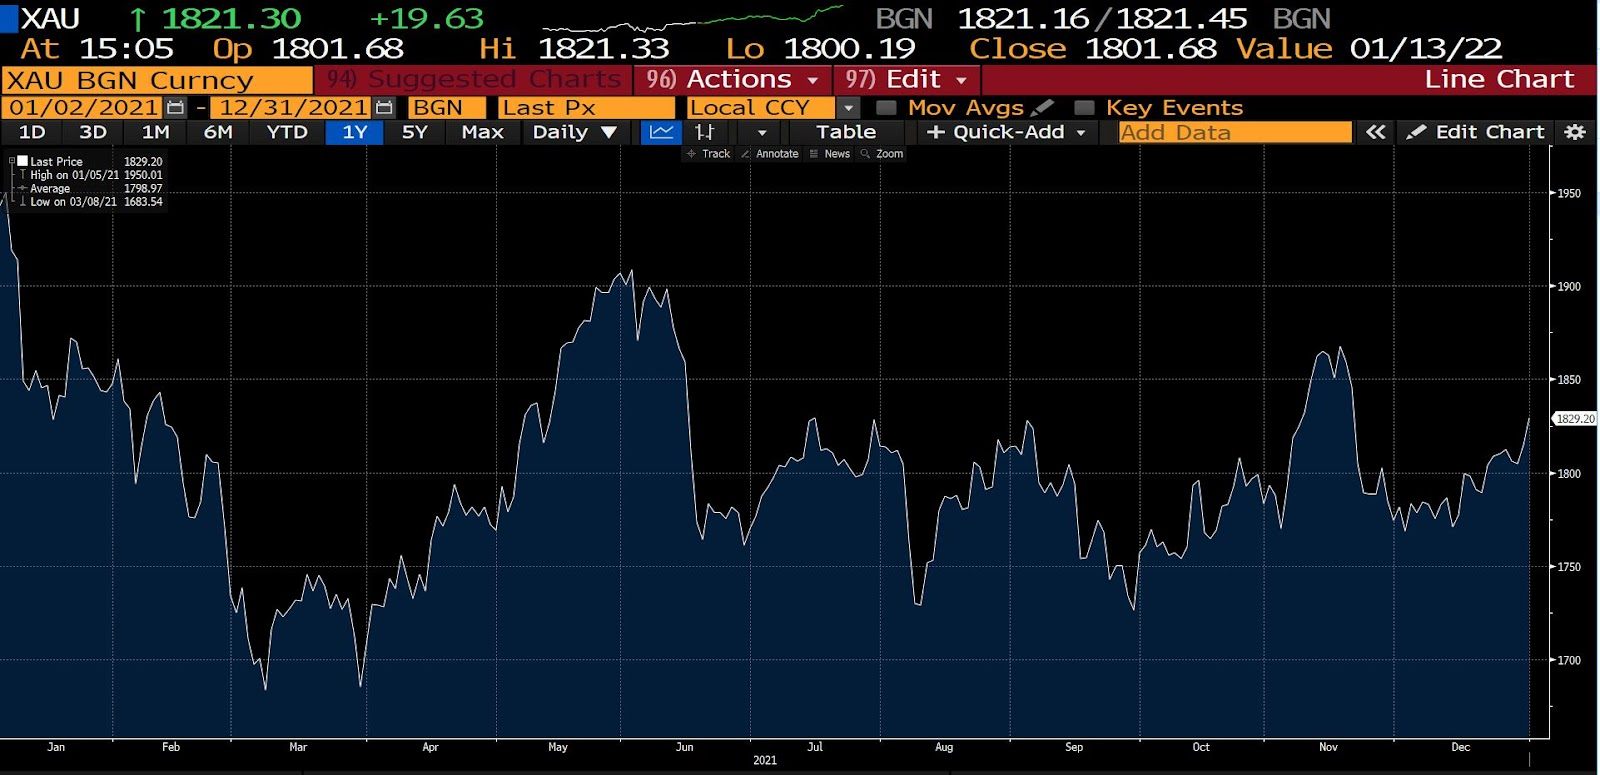
20. -3.64 Percent
Net change in the price of an ounce of gold in 2021 from $1,898.36 on December 31, 2020 to $1,829.20 on December 31, 2021.
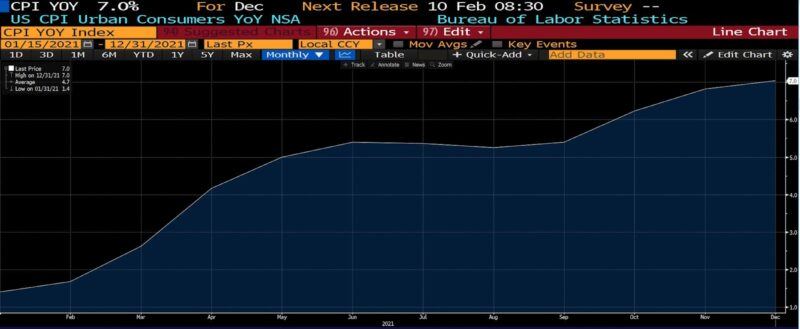
21. 7.0 Percent
On January 12, 2022, the December 2021 US CPI Urban Consumers Index (YoY) came in at 7 percent, marking the highest year-over-year US inflation rate since 1982.
Source: AIER.org
Peter C. Earle is an economist and writer who joined AIER in 2018. Prior to that he spent over 20 years as a trader and analyst at a number of securities firms and hedge funds in the New York metropolitan area, as well as running a gaming and cryptocurrency consultancy.
His research focuses on financial markets, cryptocurrencies, monetary policy-related issues, the economics of games, and problems in economic measurement. He has been quoted by the Wall Street Journal, Bloomberg, Reuters, CNBC, Grant’s Interest Rate Observer, NPR, and in numerous other media outlets and publications.
Pete holds an MA in Applied Economics from American University, an MBA (Finance), and a BS in Engineering from the United States Military Academy at West Point. Follow him on Twitter.
Become a Patron!
Or support us at SubscribeStar
Donate cryptocurrency HERE
Subscribe to Activist Post for truth, peace, and freedom news. Follow us on Telegram, HIVE, Flote, Minds, MeWe, Twitter, Gab, What Really Happened and GETTR.
Provide, Protect and Profit from what’s coming! Get a free issue of Counter Markets today.
Be the first to comment on "2021 In 21 Numbers"