
 By Tyler Durden
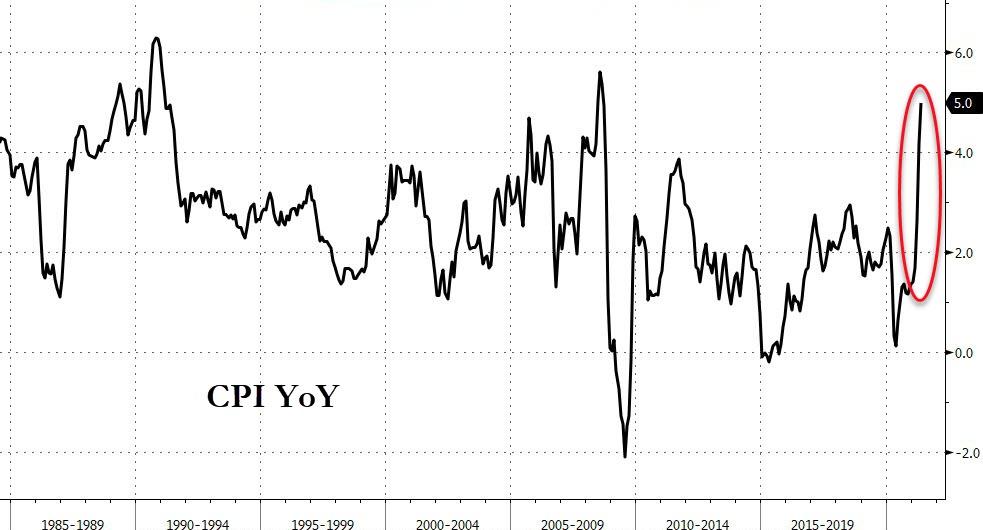
Is inflation rising?
The consumer price index (CPI), an index used as a proxy for inflation in consumer prices, offers some answers. In 2020, inflation dropped to 1.4%, the lowest rate since 2015. By comparison, inflation sits around 5.0% as of June 2021.
Given how the economic shock of COVID-19 depressed prices, rising price levels make sense. However, as Visual Capitalist’s Dorothy Neufeld notes, other variables, such as a growing money supply and rising raw materials costs, could factor into rising inflation.
To show current price levels in context, this Markets in a Minute chart from New York Life Investments shows the history of inflation over 100 years.

U.S. Inflation: Early History
Between the founding of the U.S. in 1776 to the year 1914, one thing was for sure – wartime periods were met with high inflation.
At the time, the U.S. operated under a classical Gold Standard regime, with the dollar’s value tied to gold. During the Civil War and World War I, the U.S. went off the Gold Standard in order to print money and finance the war. When this occurred, it triggered inflationary episodes, with prices rising upwards of 20% in 1918.
However, when the government returned to a modified Gold Standard, deflationary periods followed, leading prices to effectively stabilize, on average, leading up to World War II.
The Move to Bretton Woods
Like post-World War I, the Great Depression of the 1930s coincided with deflationary pressures on prices. Due to the rigidity of the monetary system at the time, countries had difficulty increasing money supply to help boost their economy. Many countries exited the Gold Standard during this time, and by 1933 the U.S. abandoned it completely.
Easiest way to get your first bitcoin (Ad)
A decade later, with the Bretton Woods Agreement in 1944, global currency exchange values pegged to the dollar, while the dollar was pegged to gold. The U.S. held the majority of gold reserves, and the global reserve currency transitioned from the sterling pound to the dollar.
1970s’ Regime Change
By 1971, the ability for gold to cover the supply of U.S. dollars in circulation became an increasing concern.
Leading up to this point, a surplus of money supply was created due to military expenses, foreign aid, and others. In response, President Richard Nixon abandoned the Bretton Woods Agreement in 1971 for a floating exchange, known as the “Nixon shock”. Under a floating exchange regime, rates fluctuate based on supply and demand relative to other currencies.
A few years later, oil shocks of 1973 and 1974 led inflation to soar past 12%. By 1979, inflation surged in excess of 13%.
The Volcker Era
In 1979, Federal Reserve Chair Paul Volcker was sworn in, and he introduced stark changes to combat inflation that differed from previous regimes.
Instead of managing inflation through interest rates, which the Federal Reserve had done previously, inflation would be managed through controlling the money supply. If the money supply was limited, this would cause interest rates to increase.
While interest rates jumped to 20% in 1980, by 1983 inflation dropped below 4% as the economy recovered from the recession of 1982, and oil prices rose more moderately. Over the last four decades, inflation levels have remained relatively stable since the measures of the Volcker era were put in place.
Fluctuating Prices Over History
Throughout U.S. history. there have been periods of high inflation.
As the chart below illustrates, at least four distinct periods of high inflation have emerged between 1800 and 2010. The GDP deflator measurement shown accounts for the price change of all of an economy’s goods and services, as opposed to the CPI index which is a fixed basket of goods.
It is measured as GDP Price Deflator = (Nominal GDP ÷ Real GDP) × 100.

According to this measure, inflation hit its highest levels in the 1910s, averaging nearly 8% annually over the decade. Between 1914 and 1918 money supply doubled to finance war efforts, compared to a 25% increase in GDP during this period.
U.S. Inflation: Present Day
As the U.S. economy reopens, consumer demand has strengthened.
Meanwhile, supply bottlenecks, from semiconductor chips to lumber, are causing strains on automotive and tech industries. While this points towards increasing inflation, some suggest that it may be temporary, as prices were depressed in 2020.
At the same time, the Federal Reserve is following an “average inflation targeting” regime, which means that if a previous inflation shortfall occurred in the previous year, it would allow for higher inflationary periods to make up for them. As the last decade has been characterized by low inflation and low interest rates, any prolonged period of inflation will likely have pronounced effects on investors and financial markets.
Source: ZeroHedge
Become a Patron!
Or support us at SubscribeStar
Donate cryptocurrency HERE
Subscribe to Activist Post for truth, peace, and freedom news. Follow us on Telegram, SoMee, HIVE, Flote, Minds, MeWe, Twitter, Gab, Ruqqus and What Really Happened.
Provide, Protect and Profit from what’s coming! Get a free issue of Counter Markets today.
Be the first to comment on "Visualizing The History Of US Inflation Over 100 Years"