

Employment has been the one stickler in my recession prediction for 2019, and finding a trustworthy measurement from the government’s statistics is like finding a virgin in a brothel. Depending on which official figures you look at, employment has refused to fall and new jobs are strong … or they stink.
We recently got two extremely conflicting reports from the same government agency that reveal, AGAIN, how dubious the official numbers from the government are. Because one report was stellar, the stock market blasted off like a rocket when it heard the news. Because the other report of the same item was abysmal, the stock market ignored it. The Fed, however, did not ignore it, and carries it in its official charts.
We’re talking the count of new job openings, as calculated by the Bureau of Labor Statistics, which by the Fed’s graphs looks like this:
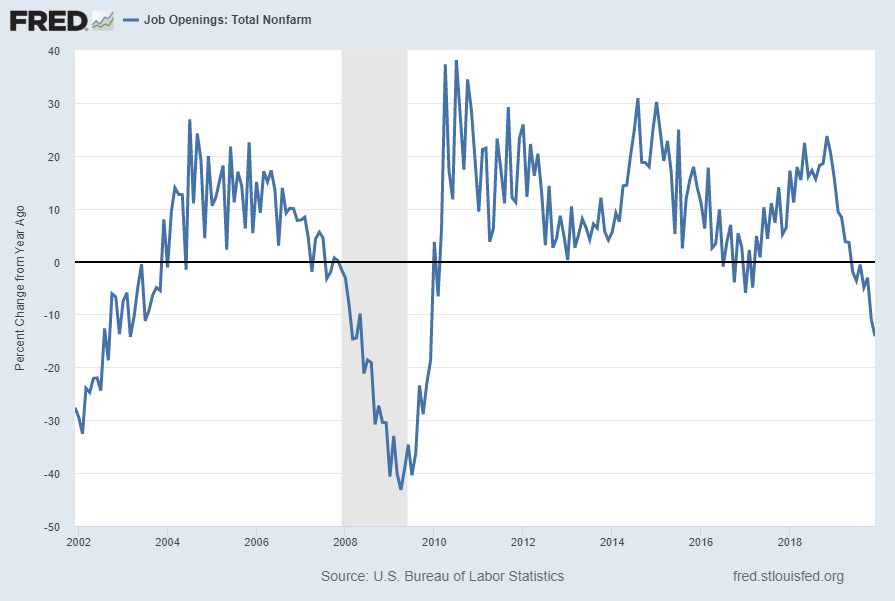
Terrible. One has to, as I’ve now pointed out with soooo many statistics, go all the way back to the days of the Great Recession to find numbers this bad. (You should see that comparison now as pattern so routine in its recurrence that it can almost be expected I will say it.)
Job openings are telling of a new trend in employment because employers stop opening new jobs before they start firing employees from existing jobs. So, it sets the stage for where we are going.
In case you thought I was making the new-jobs count look worse by showing the situation in terms of its percentage change, here is how it looks in terms of the actual total number of job openings:
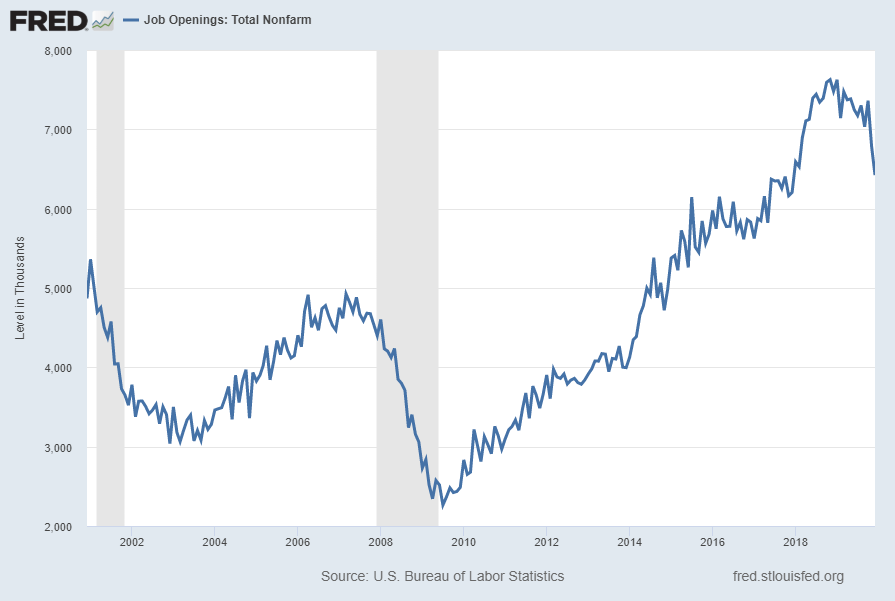
That’s the most abrupt falloff in two decades, which is going as far back as Fed stats for this measure go.
“Hold it!” you may scream. “The BLS ‘Job Report’ recently published for January was extraordinarily good. The numbers were stellar!” Yes, they were, and that is why I call it the Bureau of Lying Statistics, rather than the Bureau of Labor Statistics. The BLS reported a whopping quarter of a million new jobs added.
I’ll note in my defense that the JOLTS report in the charts above (also put out by the BLS) is the Fed’s favored metric, and that BLS report that a massive drop in the monthly change of job openings of 354,000 jobs in December.
So, what gives?
See: 177 Different Ways to Generate Extra Income
I don’t know. I’ll try to help decipher it for you (and for me), but the facet is two official reports that purport to tell us the number of new jobs created each month tell totally opposite stories.
First, I’m going to guess a good idea of which is right and which is wrong will be revealed later this year, and the worse numbers will prevail. Why? Remember how last year the BLS did its annual audit of total jobs for the year, and found its monthly “Jobs Reports” over the course of a year had shown half a million more jobs than could actually be found once they compared the total existing jobs from one March to the next? (Something they refer to as their annual “benchmark” study, which I reported on that last August in this article: “How’s That Recession Coming, Dave?” in the section subtitled “Employment now marching with me.”)
Well, I’ll bet when they do their new benchmark count this March , we find they have been over counting new jobs in their “surveys” by just as much during the past year as they did in the year before because their greatest discrepancies seem to happen around the time of recessions (probably because their usual multitude of assumptions used for “adjustments” don’t work so well during contrary times … or, to be less charitable, because the government wants to make the numbers look as positive as they can, even if that only happens subconsciously through the choices settled upon due to goal seeking.)
Just take the “L” out of “BLS,” and you’ll have your explanation. You can mark me wrong if the BLS’s eventual published total from its March benchmark study comes out otherwise. Since it only make mistakes of this grandeur during recessions, that does kind of lead one to believe they love to overstate new jobs during the darkest of times to make things feel less dire. They are, after all, governed by whatever administration is ruling at the time, and all administrations love to make themselves look good; and each new administration puts its own people at the top, who can push the agenda.
A miss is as good as mile, well, actually as a million
So, how bad was the last quarter in terms of new job openings (since I said the last quarter of 2019 would be the one where a recession starting late in the summer would really show up in the numbers)?
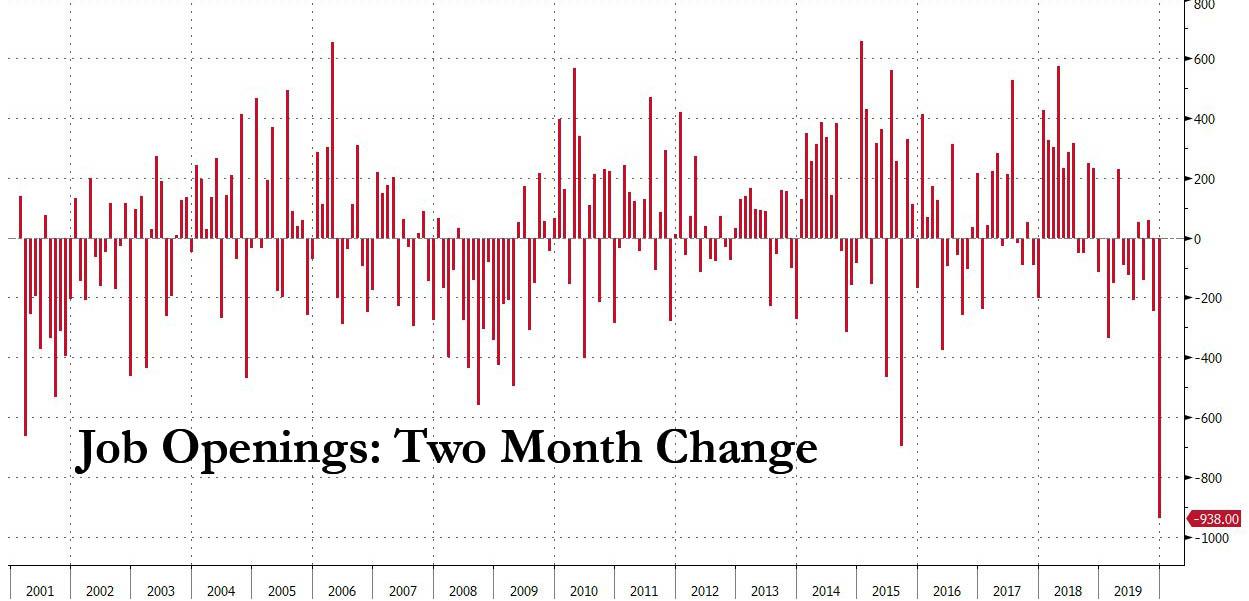
That bad! Yes, that’s a drop of nearly one million job openings in the last two months of 2019, making that the largest cliff dive in new jobs in two decades (maybe longer)! Add in the two-month period before those two months and you have well over a million fewer job openings on the market than there were in the summer. Uhhgly!
But the economy is “strong, very strong.” Ask the president. “Strongest economy ever.” I guess the world is willing to readily accept that all things are true so long as someone of note says them because I didn’t hear anyone in the mainstream media question him on that statement.
One of the other things that has led me to call the BLS the “Bureau of Lying Statistics” (to recall in case you are new around here) has been how I’ve noted the bureau will “adjust” its new jobs number up in December one year “due to unseasonably warm weather” and then adjust its new jobs number up again the next December “due to unseasonably cold weather!” The devil is in the adjustments, which seem to run whichever way the bureau wants them to, even using the same excuse. That, or there is only one temperature that allows new jobs to remain the same and no temperature that would justify them being revised down!
In advance, beware the huge explosion in new jobs that is coming this spring. That will be almost entirely due to temporary hiring of a quarter million census takers. whose jobs will end again in the fall. I wouldn’t even be completely surprised if the Bureau of Lying Statistics counts the new jobs in the spring, but adjusts the corresponding job losses out in the fall on the basis that they were only temporary.
Another half-truth by the BLS is that it counts half-time jobs the same as full-time jobs. It should count full-time equivalency to be meaningful or break full-time and part-time jobs into side-by-side reports. We have a labor market where numerous full-time jobs were lost in the Great Recession and have been replaced with part-time jobs that pay less and have no benefits. The BLS acts as if that is meaningless — at least, in terms of its headline numbers.
With contradictions so stark in their own reports, it seems like the BLS is a two-headed monster with one head lying to the other. Zero Hedge has reported on this discrepancy for years: See “This Is What Happens When The Bureau Of Labor Statistics Is Caught In A Lie.” I guess you just have to decide which head you’re going to believe, but the annual benchmark count of total jobs indicates the BLS leans strongly toward over-counting each month during bad times.
Here, until now, was the worst divergence on record between the two BLS reports:

The discrepancy between the BLS’s just released JOLTS report for December and its December “Jobs Report” is actually even greater than that because, while JOLTS showed the number of job opening on the market fell by a massive 354,000 compared to the month before, the December Jobs Report showed they rose by 145,000 for a total discrepancy of … half a million jobs! (It seems the BLS has a particular fondness for discrepancies in the half-million range.)
I say something is badly broken.
BLS bull and obfuscation
To be sure, BLS data is hard to decipher. For a number of years, the number of hires reported was greater than the number of job openings:
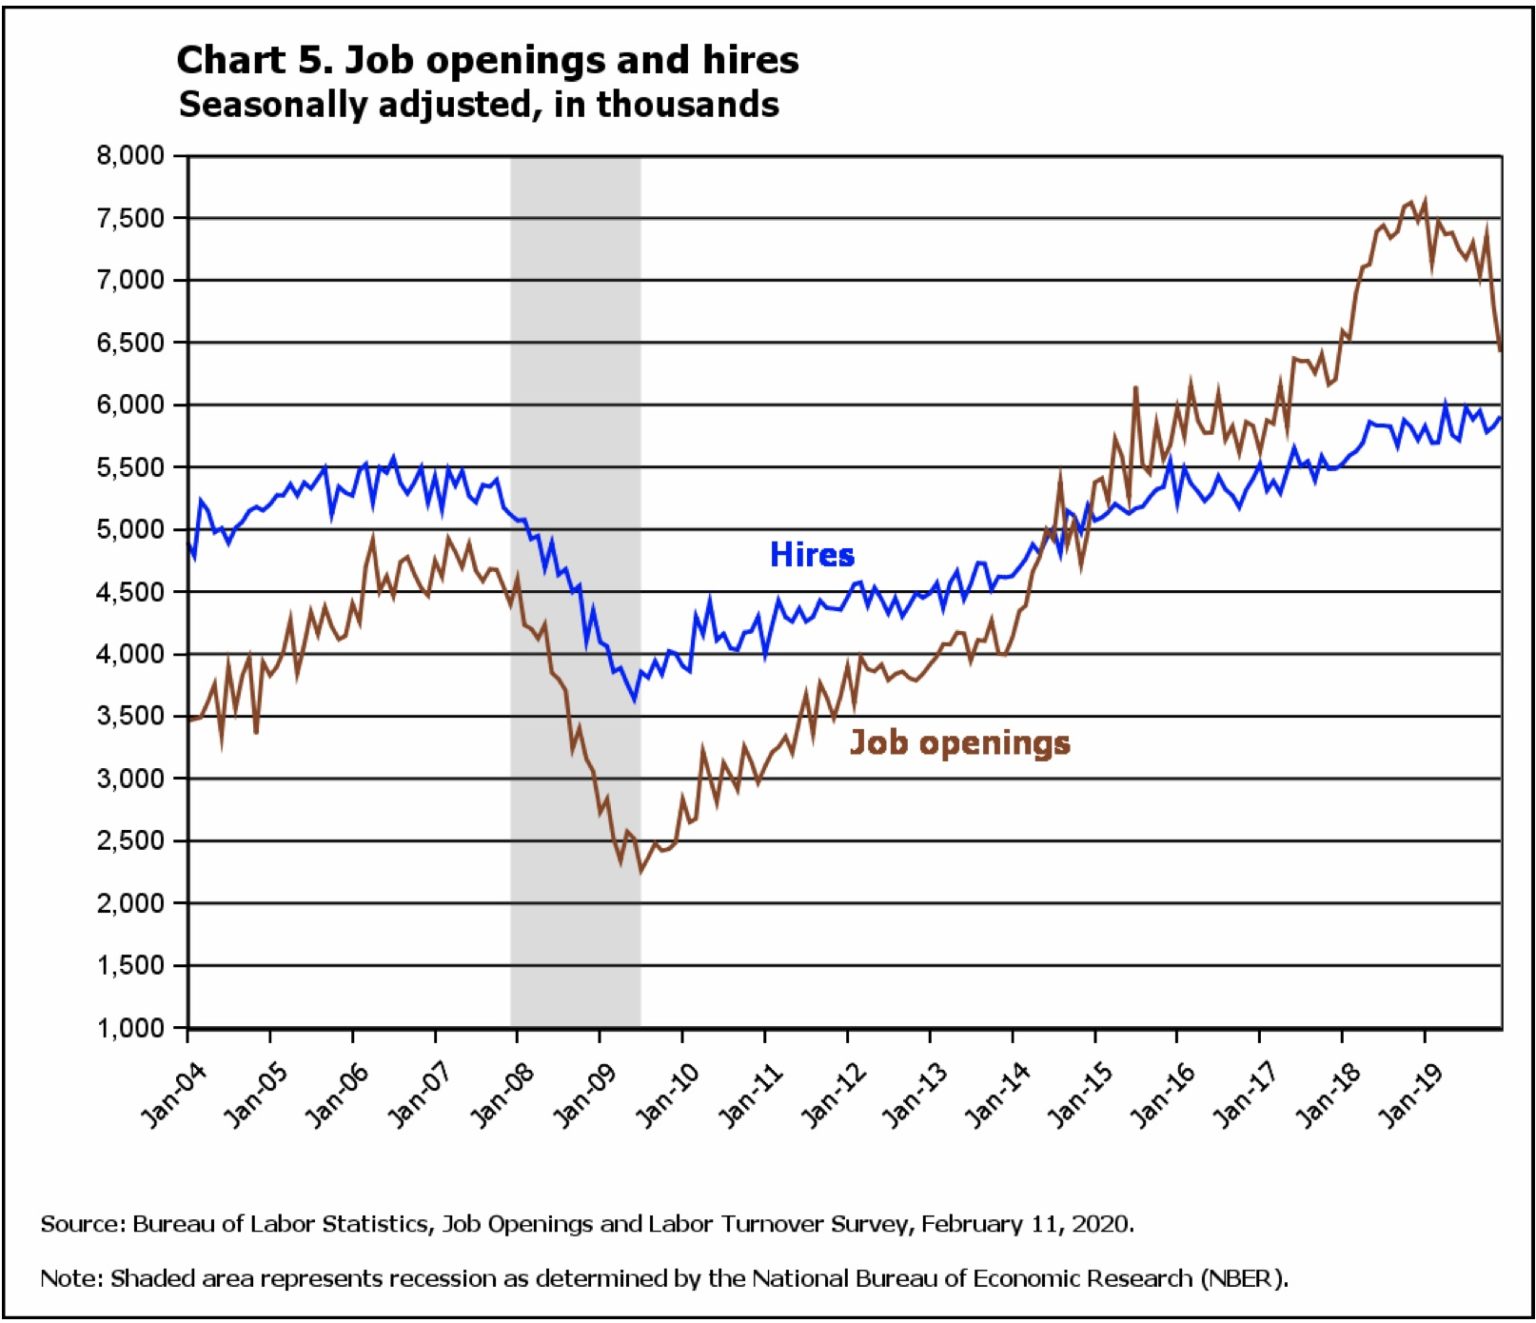
Now the number of openings is catching back down to the number of hires. How on earth can you hire more people for years and years than you have openings for? An “opening” to me (and I think to most people) means a job (whether old or new) that is available for someone to take, and the BLS doesn’t explain its meaning in its December report, even though it comments that for years there were more “hires” than “openings.” That is absurdly impossible.
I can understand how you can hire fewer people than you have openings for, leaving some open jobs unfilled (as appears to have been the case in the last few years of that graph), but not how you can hire more. How do you hire people for jobs you don’t even have open? Especially, not for years and years. Maybe it’s those darn seasonal adjustments.
To overcome my understanding deficit, I tried to drill down in the BLS FAQs page for definitions and techniques. The BLS explains how its numbers are calculated here, possibly accounting for some of the differences in its reports, but I find the explanations as obtuse as the numbers.
Given the language in the last graph, I was thinking maybe the difference in numbers is that one set of figures represents actual new hires, while the other is just a measure of jobs being offered (what I would call “openings“) one month that were not offered the prior month. Hence “new jobs.” Here, however, is the BLS definition of “openings”:
What are openings? These are either establishments with positive third month employment for the first time in the current quarter, with no links to the prior quarter, or with positive third month employment in the current quarter following zero employment in the previous quarter.
If you can understand it at all, that sounds generally like a “hire” to me — an increase in employment — since it is referred to as “employment,” not “job listings.” Naturally, it is worded as obtusely as only the government can manage.
Elsewhere, however, the BLS defines “job openings” like this:
How does JOLTS define Job Openings?
JOLTS defines Job Openings as all positions that are open (not filled) on the last business day of the month. A job is “open” only if it meets all three of the following conditions:
So, which is it? “Establishments,” “employment,” or “positions?” Since I admittedly cannot decipher the BLS’s BS, I’ll have to go with the Fed in preferring the JOLTS numbers over the “Jobs Report,” especially since the BLS’s annual “benchmark” audit last March knocked off half a million jobs from what its Jobs Reports had indicated were accruing throughout the year.
Even the BLS knows its two ways of reporting new jobs differ greatly, and must get frequently asked why that is so because it tries to explain the difference in another FAQ this way:
It would seem logical that the implied employment change from JOLTS would match the CES over-the-month change on a monthly basis, but it often does not. Several reasons are outlined here:
1. The JOLTS program was not designed to measure over-the-month employment change while the CES survey was. Consequently, the JOLTS survey differs from the CES in its methodology and data elements collected.
Uh, yeah, as in GREATLY. They differ greatly, yet both pretend to give a picture of the growth or decline in new jobs for a given month.
Both the JOLTS and the CES programs are sample surveys and both are subject to sampling error. The two programs have differing levels of reliability because the CES collects data from far more establishments than the JOLTS program.
Uh, yeah. Apparently a LOT of sampling error and a lot of difference in reliability.
The two surveys have differing seasonal patterns.
Do seasonal patterns for the same month being reported differ from each other? Why should they have different ways of adjusting for seasonality? Maybe they do when you need the new jobs count to look better one December because of unseasonably warm weather and then need it to look better the very next December due to unseasonably cold weather.
You can read the rest of their explanations for the vast differences that occur at times in the two reports, but I’ve had enough. The bottom line is the reports are claiming they are reporting the number of added or subtracted jobs each month, and they have a very large number of difference in how they are calculated (and in assumptions and adjustments being made), leading sometimes to massive discrepancies, even in polar-opposite directions, and they clearly cannot both be right.
In which case, which one of these currently totally contradictory reports, if any, is an accurate picture of what is happening with job gains or losses in any given month? In fact, the acknowledged discrepancies are why the BLS conducts a “benchmark” audit of the actual total number of existing jobs in the economy once a year, to see what the true number of jobs added over a year was to establish that as the new benchmark for the next year. When that’s off by half a million (two times the largest number the BLS had in any one of the twelve months), they’re not even close! When you look over the total number of assumptions and adjustments and realignments made, you’ll see there is ample room for goal-seeking and maybe even outright BS.
I guess it will just have to suffice to say the government has officially reported robust job growth numbers and abysmal job numbers in the last two months, so you pick which set you want to go by! The Federal Reserve seems to favor the JOLTS numbers as its standard to place on its “dashboard” for evaluating its binary mandate of maintaining solid employment and low inflation. By that count, the current economy drinks dishwater!
Before I go, here’s one more thing I’ve seen lately that gets me. Several times I’ve read about the rise in the equally mysterious “unemployment” numbers in a softened manner like this:
The unemployment rate edged slightly higher to 3.6%, as more people decided to look for jobs….
In the words, more of the millions of people who are unemployed but were not being counted as unemployed have decided to step back into the labor force and so are now being counted. It’s always presented as though this means the edge up in unemployment is actually a good thing when all it really reveals is a move by the masses of uncounted unemployed back into the job picture:
“It’s great to see that people have hope and want to get back out there… So the bottom line is that the unemployment rate only increased because of all the people coming into the labor force, although it’s worth cautioning that was probably a weather effect too,”
When to adjust and when not to adjust
And here is an example from that same article of how the BLS does not adjust the job numbers down for seasonality when extremes in weather made the numbers better than normal:
Job growth in the construction, health care, transportation and warehousing industries was particularly strong in January, according to the US Bureau of Labor Statistics’ report. Unseasonably mild weather in January helped the construction and transportation sectors, Capital Economics Chief US Economist Paul Ashworth wrote in a note.
So, this time construction and transportation were up due to unseasonably warm weather, but the BLS kept the reported numbers up, rather than adjusting them, and the chief US economist just explained why they were up in a note! Yeah, just as I thought. They’re the BS Department. They’ll adjust the numbers up when unseasonable warmth caused the reported numbers to fall; but they won’t adjust them down when unseasonable warmth is why they were higher than usual.
Why would they do that? Well, maybe because of the next words in that article:
Manufacturing jobs declined for the second month in a row. The sector was in a downturn in the last five months of 2019…. But the sector’s weakness isn’t yet a cause for concern for investors until transportation jobs follow a similar pattern…. This suggests the manufacturing downturn is somewhat contained. A slump in transportation jobs would imply a more broad-based downturn in the production, trade and delivery of goods.
How convenient. We’ll just NOT adjust the transportation numbers for unseasonably warm weather this time, since that would make them look bad, and tuck the explanation for why they were not adjusted in a note so they don’t create too much stir with investors.
“Do not adjust your television set. We control the vertical; we control the horizontal” … and the picture you’ll get is the one we want you to get.
(See my earlier coverage of what a constant pack of lies (or confusion) is put out routinely by the “Bureau of Lying Statistics.”)
Support David Haggith on Patreon HERE
Article source: The Great Recession Blog
Subscribe to Activist Post for truth, peace, and freedom news. Become an Activist Post Patron for as little as $1 per month at Patreon. Follow us on SoMee, Flote, Minds, Twitter, and Steemit.
Provide, Protect and Profit from what’s coming! Get a free issue of Counter Markets today.
Be the first to comment on "What to Make of the Bureau of Lying Statistics’ Contradicting Jobs Reports"