
 By Tyler Durden
After the 2008 crisis forcefully shoved the faces of most countries directly into the mess they had created, most major global economic participants arrived at the obvious conclusion that since debt caused the crisis to begin with, a deleveraging was necessary in coming years.
But instead, just the opposite has happened, according to Bloomberg: central banking cowardice and flawed monetary policy have, over the last decade, dug the world deeper into the hole it was in prior to the crisis. In the U.S., for instance, debt has shifted between industries, but it has not gone away. China, once relatively responsible in its debt positioning, has now emerged as the newest bastion for taking on debt to encourage growth.
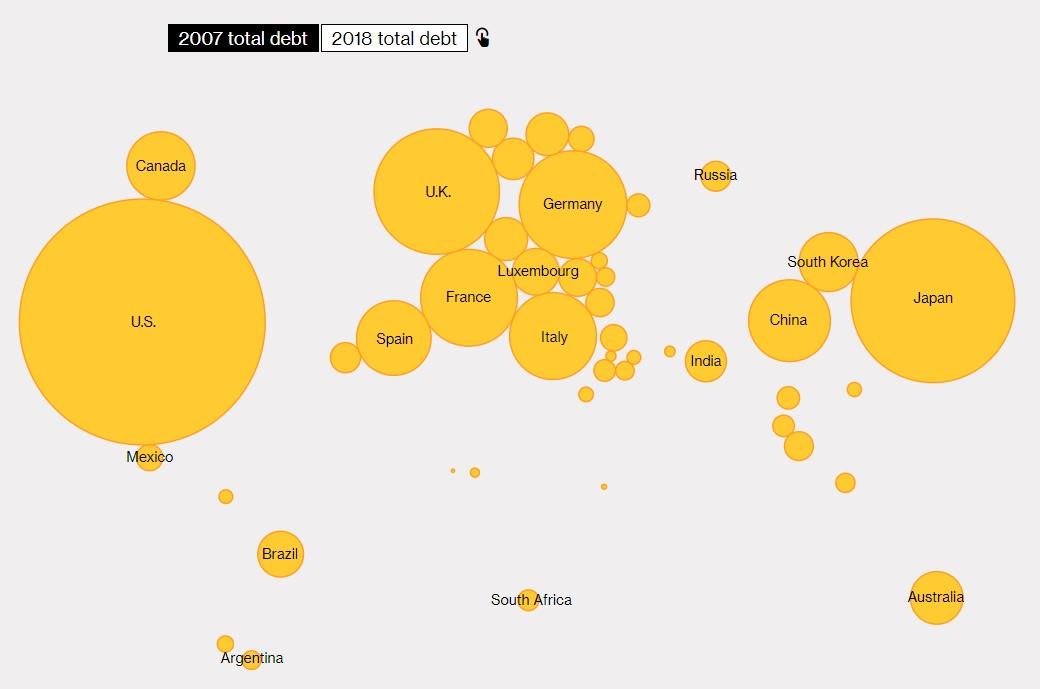
Here’s a graphic representation of debt in 2007:
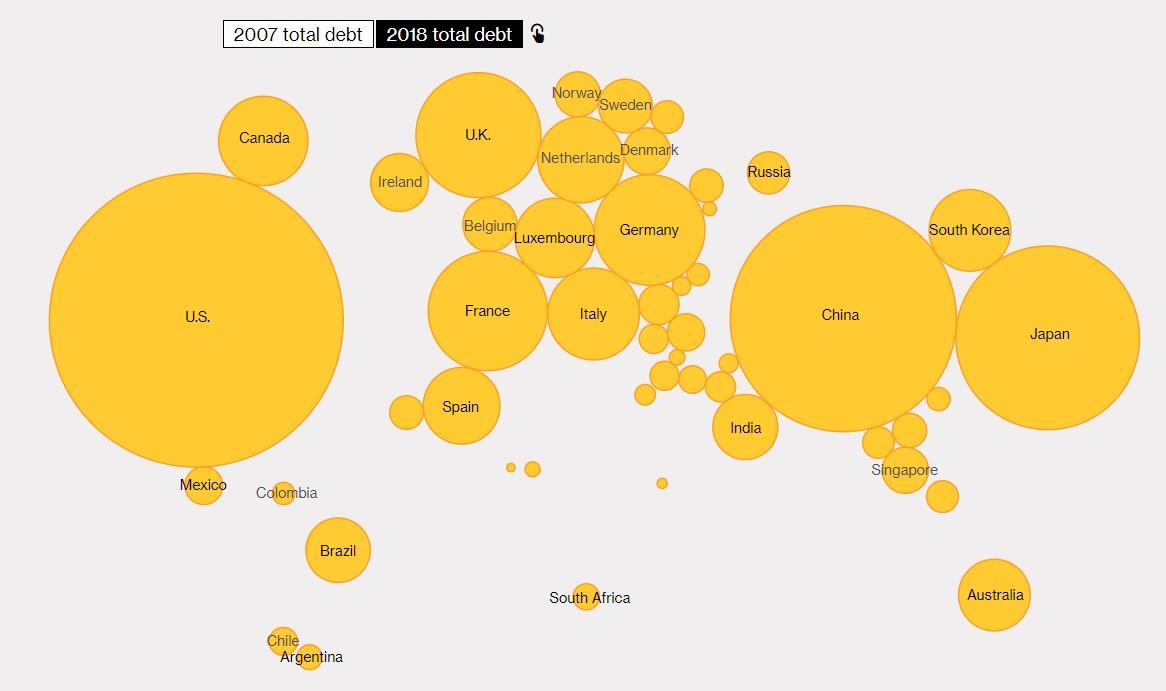
And where we stood in 2018:
It was well known in Wall Street circles that there was simply too much leverage prior to the 2008 crisis. Bankers would reportedly compare U.S. household debt to GDP against the personal saving rate, which painted a clear picture of the chaos that would be coming. Here’s how those numbers stacked up during 2008, versus where they are today:
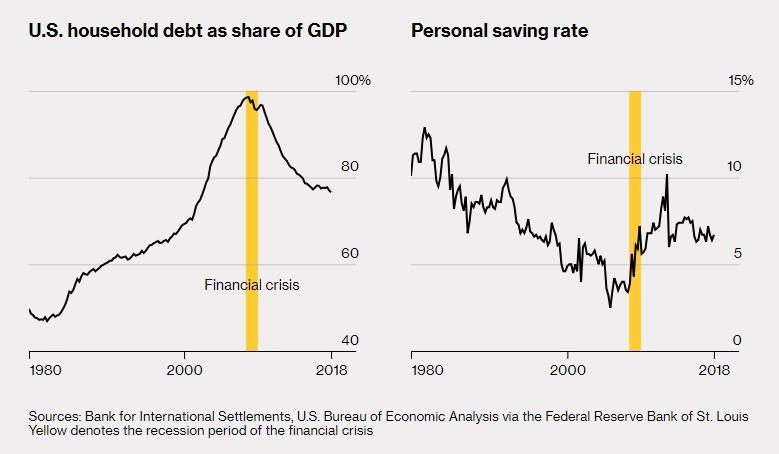
Heading into the financial crisis, consumers were over-leveraged as low rates allowed them access to cheap credit – sound familiar? At the same time, European banks were suffering meaningful losses.
Of course, nobody likes a deleveraging, no matter how absolutely necessary it is: it’s uncomfortable, generally results in underconsumption and it leads to collapsing economic growth. So instead of dealing with that discomfort, post-crisis, central banks just cut rates leading to even more leverage. In addition, the world discovered a new “borrower of last resort” in China, whose debt has skyrocketed over the last decade, putting it alongside of the U.S. as leaders in global debt.
By 2008, household debt accounted for 98% of U.S. GDP. While spending excesses have been reined in to some degree, the country is seeing new types of debt come to prominence. Auto loans and student loans, for instance, have doubled since the crisis, moving from $1.36 trillion to $2.73 trillion.
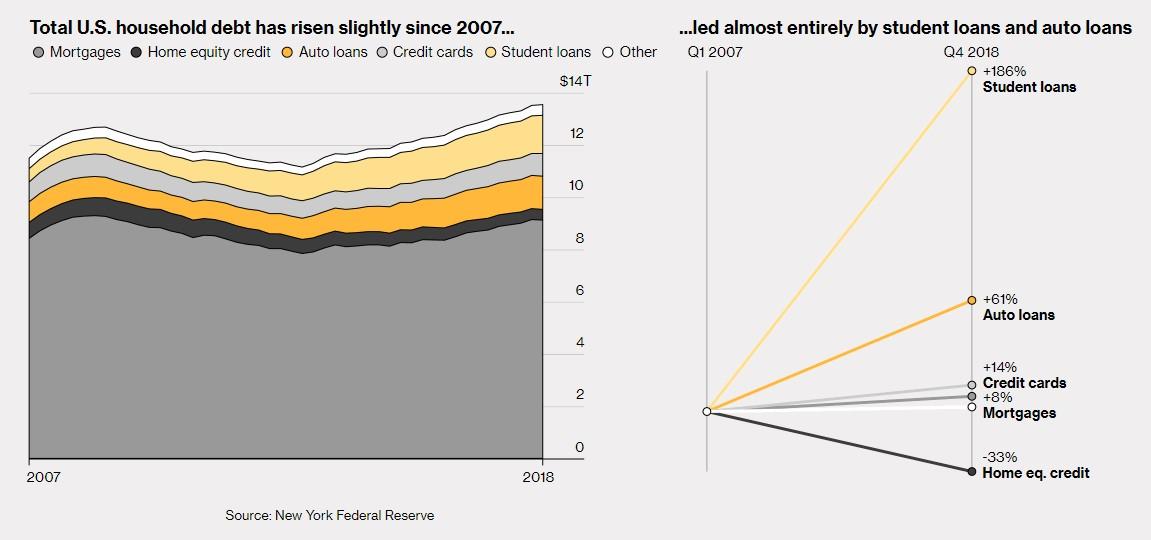
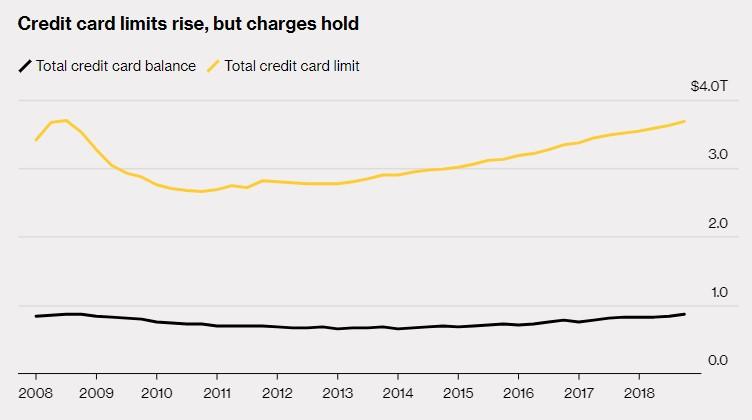
The news isn’t all terrible. If you’re a perma-bull (or you work for the New York Fed) and are looking for one metric to hang your hat on, you could note that housing debt is lower than it was ten years ago, and Helocs have declined sharply. And as banks have offered more credit to card holders, balances haven’t been rising in concert – yet.
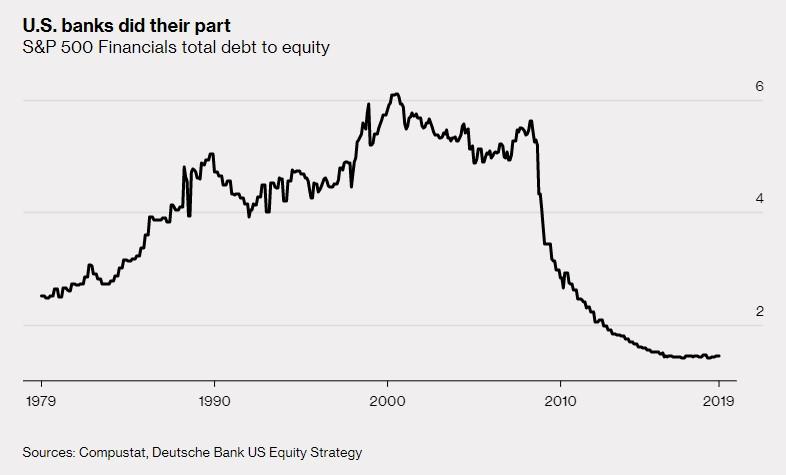
And (for now) banks seem to be on better footing. After the crisis, banks in the U.S. deleveraged as the government stepped in to rescue them. Since being re-regulated, they have used low rates to put their financial houses back in order. It’s amazing how trillions of dollars in freshly printed bailout money and low rates can really shore up a bank’s debt to equity ratio.
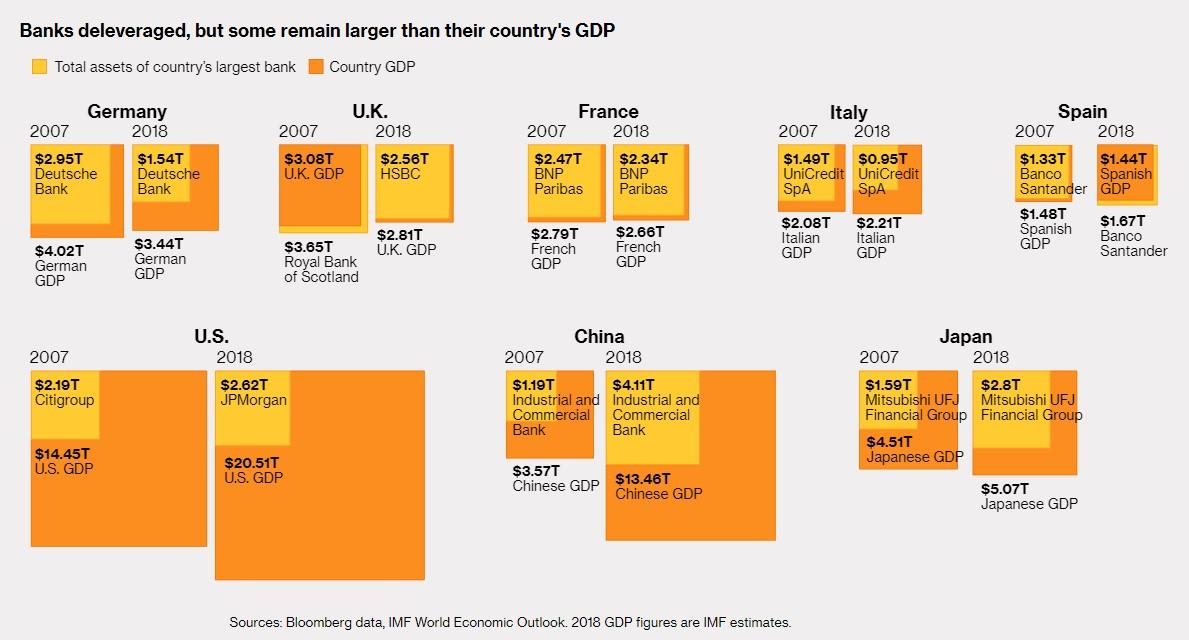
Banks in Europe have also started to deleverage. Germany has seen its banking assets go from 3x its GDP to about 2x its GDP now. And many of the big banks in Europe are too large for their respective governments to ever step in and rescue them, should the situation again warrant it. Banks in the euro zone over the last decade have cut back their assets by an amount equivalent to the region’s entire GDP.
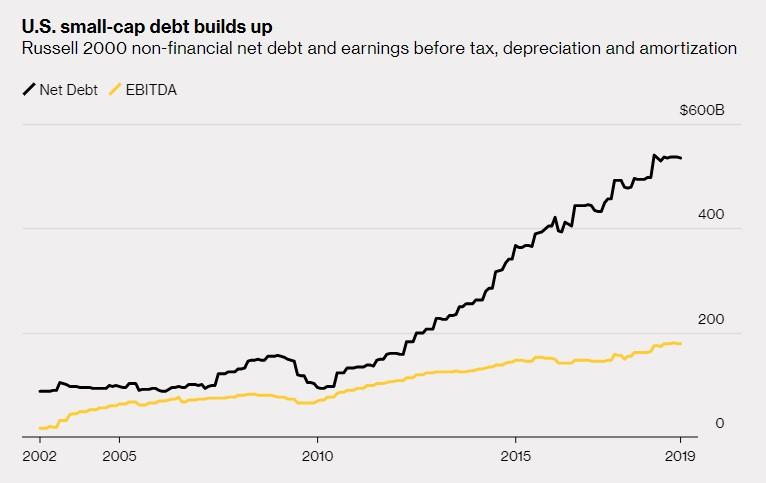
Non-bank corporations were less leveraged entering the 2008 crisis than they were at the beginning of the decade. Since then, new debt has outpaced the free cash that these companies have been generating – especially companies that make up the Russell 2000 index. This could suggest further vulnerabilities going forward.
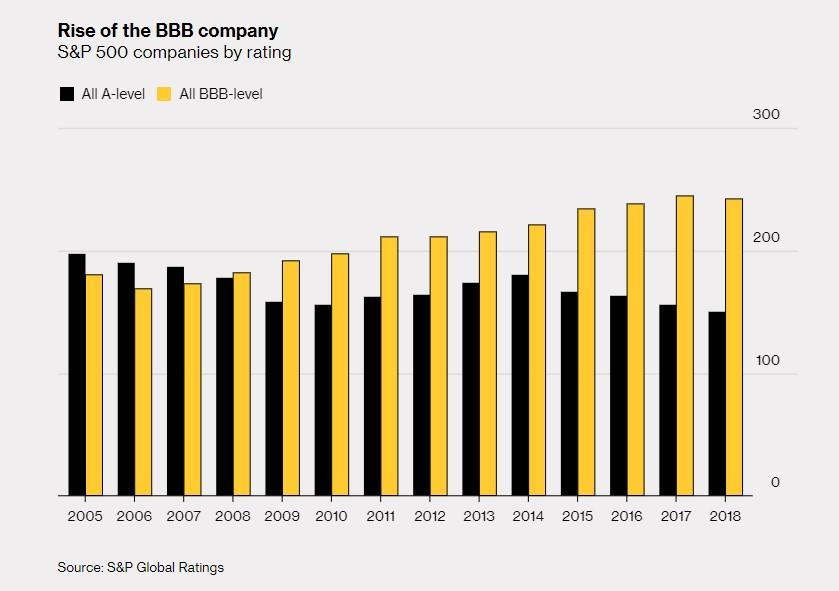
Perhaps the most frightening detail is that companies rated BBB+, BBB, or BBB- (the three lowest grades before they would hit “junk” status and be faced with higher interest payments) now outnumber companies with some level of debt rated A. Companies appear to be purposely toeing the line between BBB- and junk, trying to take on as much debt as possible before getting downgraded. From the below chart, you can see how it looks like companies are “pushing it”:
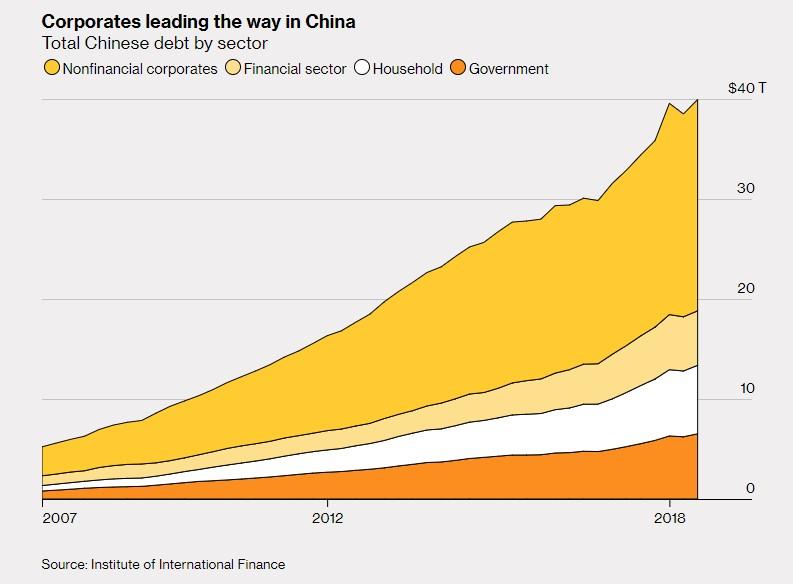
But nothing in the U.S. could compare to the obscene amount of debt China has taken on in the last decade to fund its own growth and stave off recession. Prior to the crisis, the country had financed its growth without abusing debt. Household debt in 2008 was equal to 18.8% of China’s GDP. That number is now 51%. China’s total debt has increased about 700% since the crisis and it accounts for 70% of new debt taken on anywhere in the world since the crisis.
The debt splurge has reluctantly kept the wheels of China’s economy grinding. It has also kept demand for Western products robust. Without this demand, Western banks and consumers may not have been able to deleverage as much as they have. However, China’s debt is doing little to prevent the country’s now-dwindling growth in output.
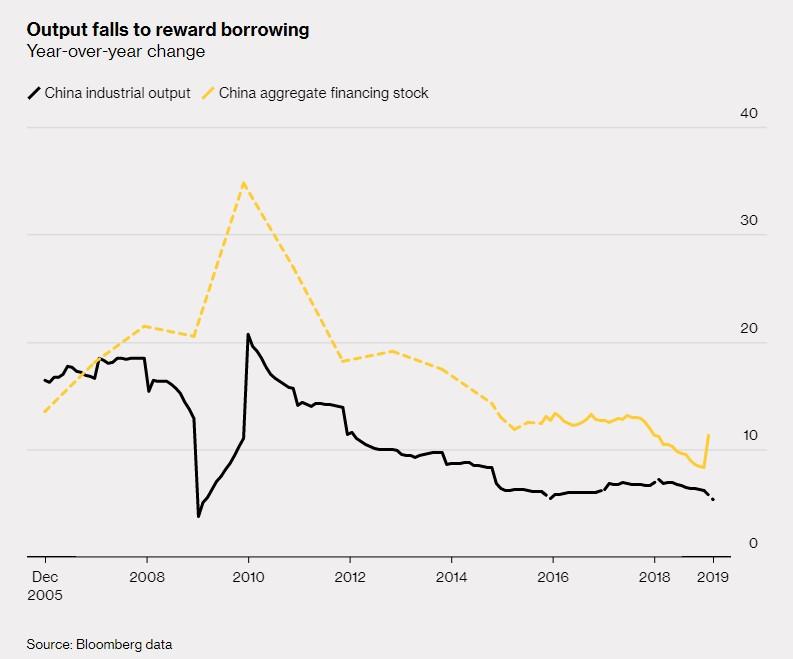
And of course, the Chinese want to deleverage, but they also don’t want growth to drop under 6% per year. Every time the country goes to regulate banks and lending, growth falls, and the country capitulates to keep its growth number elevated.
The country’s aspirations to be the best at something worldwide have finally come to fruition: China has now replaced the U.S. as the “source of greatest anxiety over debt.”
We can’t wait to see how it all comes crashing down next time.
Be the first to comment on "11 Charts Show The World Has Learned Nothing From Global Financial Crisis"