
 By Tyler Durden
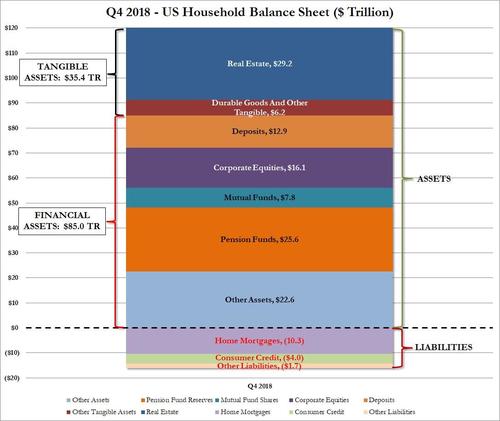
In the Fed’s latest Flow of Funds report released at noon today, the Fed published the latest snapshot of the US “household” sector as of Dec 31, 2018. What it revealed is that with $120.4 trillion in assets and a modest $16.1 trillion in liabilities, the net worth of US households dipped to $104.3 trillion, its first drop after 12 consecutive quarters of increases, and down $3.7 trillion as a result of the near-bear market in the fourth quarter, which wiped out estimated $4 trillion in various financial assets like corporate equities, mutual and pension funds, and deposits after the market tumbled in Q4, offset by a $345 billion increase in tangible assets, of which $280 billion was in real estate values.
Total household assets in Q4 dropped 3.7 trillion to $120.4 trillion, the first drop since Q3 2015, while at the same time total liabilities, i.e., household borrowings, rose by $133 billion from $15.9 trillion to $16.1 trillion, the bulk of which was $10.3 trillion in home mortgages. Homeowners’ real estate holdings minus the change in mortgage debt rose by $223 billion (a positive number means that the value of real estate is growing at a faster pace than household mortgage debt).
The breakdown of the total household balance sheet as of Q4 is shown below.
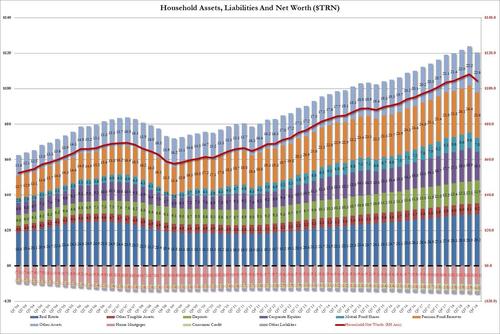
And here is the historical change of the US household balance sheet: it shows the first drop in household net worth in nearly four years.
And since the bulk of net worth is held by a tiny fraction of US households, just like on the way up it was roughly 1% of Americans who benefited from the near doubling in net worth from $58.9 trillion after the financial crisis to $108.1 trillion as of Q3 2018 when the S&P hit an all time high, so the drop in the last quarter only truly affected a sliver of the population, since most of America’s assets are held in financial market derivatives.
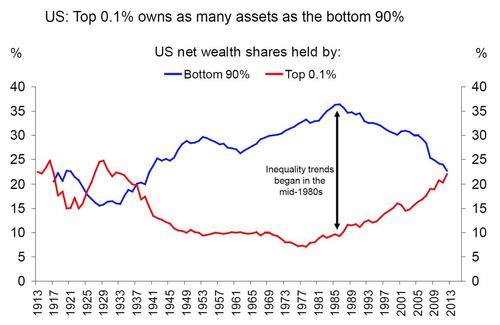
Which once again brings up the age old problem of the US wealth divide: as the following chart from Deutsche Bank shows, the wealth inequality in the US is now as bad as it just during the Great Depression, with the top 0.1% of the US population owning as many assets as the bottom 90%.
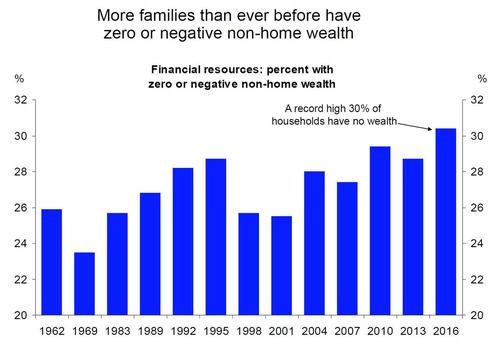
In the CBO’s latest, if somewhat dated, Trends in Family Wealth analysis published in 2016, the budget office showed a breakdown of the net worth chart by wealth group, which sadly shows how the “average” American wealth is anything but, and in reality most of that $100 trillion belongs to just 10% of the US population.
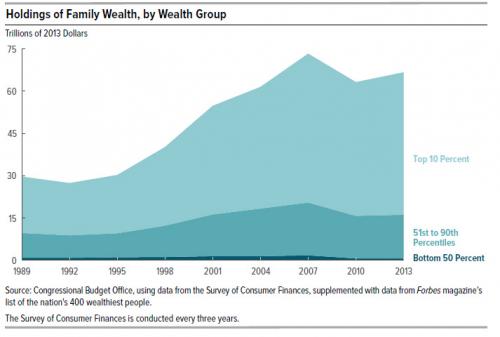
While the breakdown has not caught up with the latest data, it provides an indicative snapshot of who benefits. Here is how the CBO recently explained the wealth is distributed:
- In 2013, families in the top 10 percent of the wealth distribution held 76 percent of all family wealth, families in the 51st to the 90th percentiles held 23 percent, and those in the bottom half of the distribution held 1 percent.
- Average wealth was about $4 million for families in the top 10 percent of the wealth distribution, $316,000 for families in the 51st to 90th percentiles, and $36,000 for families in the 26th to 50th percentiles. On average, families at or below the 25th percentile were $13,000 in debt.
In other words, roughly 75% of the $2.2 trillion increase in assets went to benefit just 10% of the population, who also account for roughly 76% of America’s financial net worth.
It also means that just 10% of the US population owns roughly $93 trillion of all US assets, while half of the US population has virtually no wealth, and if anything it is deeply in debt.
Even worse, when looking at how wealth distribution changed from 1989 to 2013, a clear picture emerges. Over the period from 1989 through 2013, family wealth grew at significantly different rates for different segments of the U.S. population. In 2013, for example:The wealth of families at the 90th percentile of the distribution was 54% greater than the wealth at the 90th percentile in 1989, after adjusting for changes in prices.
- The wealth of those at the median was 4 percent greater than the wealth of their counterparts in 1989.
- The wealth of families at the 25th percentile was 6 percent less than that of their counterparts in 1989.
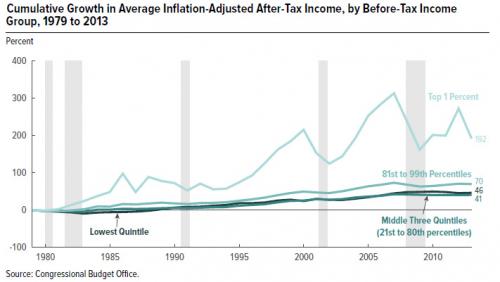
- As the chart below shows, nobody has experienced the same cumulative growth in after-tax income as the “Top 1%”
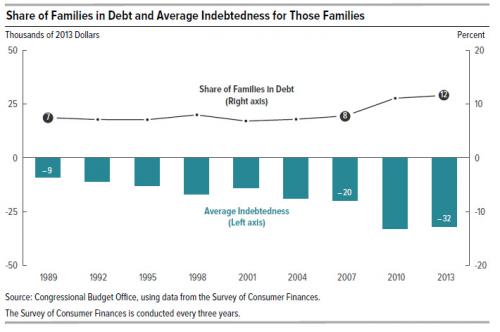
The above is particularly topical at a time when either party is trying to take credit for the US recovery. Here, while previously Democrats, and now Republicans tout the US “income recovery” they may have forgotten about half of America, but one entity remembers well: loan collectors. As the chart below shows, America’s poor families have never been more in debt.
The share of families in debt (those whose total debt exceeded their total assets) remained almost unchanged between 1989 and 2007 and then increased by 50 percent between 2007 and 2013. In 2013, those families were more in debt than their counterparts had been either in 1989 or in 2007. For instance, 8 percent of families were in debt in 2007 and, on average, their debt exceeded their assets by $20,000. By 2013, in the aftermath of the recession of 2007 to 2009, 12 percent of families were in debt and, on average, their debt exceeded their assets by $32,000.
The increase in average indebtedness between 2007 and 2013 for families in debt was mainly the result of falling home equity and rising student loan balances. In 2007, 3 percent of families in debt had negative home equity: They owed, on average, $16,000 more than their homes were worth. In 2013, that share was 19 percent of families in debt, and they owed, on average, $45,000 more than their homes were worth. The share of families in debt that had outstanding student debt rose from 56 percent in 2007 to 64 percent in 2013, and the average amount of their loan balances increased from $29,000 to $41,000.
Finally, while Q4 household net worth suffered its biggest drop – in absolute dollar terms – since the financial crisis, when it plunged by $3.8 trillion dollars, in percentage terms the decline was far smaller. Furthermore, thanks to the sharp rebound in markets in the first quarter, it is likely safe to say that households have recouped most of their losses and absent a major drop in stocks in the next 3 weeks, US household net worth will likely hit a new all-time high some time in the next month or two, a reversal that will not be lost on the socialist wing of the democratic party whose core political campaign is to take as much of this wealth away from America’s “top 1%” and redistribute it as they see fit.
By Tyler Durden / Republished with permission / Zero Hedge
This article was sourced from The Mind Unleashed.
Be the first to comment on "US Households See Biggest Drop in Net Worth Since the Financial Crisis"