
 |
| Image: Zero Hedge |
Mac Slavo
Activist Post
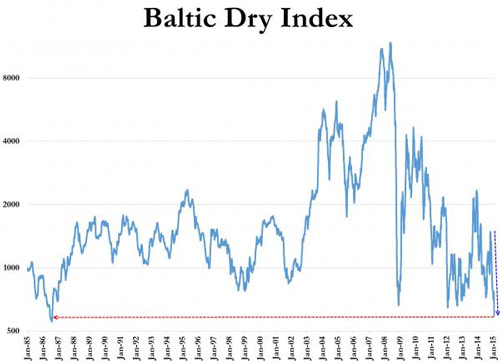
The Baltic Dry Index (BDI) is used by economists and stock traders alike as a leading economic indicator because it predicts future economic activity. The index tracks in US dollars and measures global supply and demand for commodity shipments among bulk carriers including raw materials like lumber, coal, metallic ores, and grains. What makes this particular measurement so distinct from others, according to economic Howard Simmons, is that the BDI “is totally devoid of speculative content” because “people don’t book freighters unless they have cargo to move.”
When cargo is moving the price to move that cargo rises. During the boom-times of the mid 2000s the Baltic Dry Index hit historical record highs of over $8000 for charter higher rates. It promptly collapsed to under $1000 into mid-2008, just ahead of the stock market crash.
What you’re about to see may shock you if you’re of the opinion that an economic recovery has taken hold.
Not only has the index lost 90% of its value in the last several months, but according to Zero Hedge it is just a day or two away from its all-time record lows.
Where is the global economy headed in the next few months?
If The Baltic Dry Index is any guide, it’s about to implode.
And the collapse just keeps going… since Thanksgiving, The Baltic Dry has fallen on 43 or the 47 days, down over 60% from the “China growth is back and all-is-well” hope-filled days of late October (when Jim Cramer “stressed the importance of watching the Baltic Dry Freight Index,” as his bullish thesis confirmation). At 569, The Baltic Dry is inching ever closer to what will be the lowest level ever (554 on 7/31/1986) for the global shipping cost indicator…
One or two more days like this and it will be the all-time low…
It should be obvious, despite the machinations from governments and central banks the world over, that the economy is coming to a standstill. The collapse in the oil price has certainly pushed it along, but the problems go much deeper.
According to many contrarian analysts we’re so far gone that at this point nothing will stop it:
We are setting up for a collapse that is going to be worse than 1929, and it’s going to come sometime within the next two years. It could come as soon as the next couple of months, but it is going to happen, and there’s nothing that is going to stop it.
Going forward we will see continued volatility with wild price swings for all asset classes, including gold and oil. It is a sign of a system on its last legs; and for those who have failed to prepare a backup plan things are going to be horrific.
It’s imminent. Get ready.
You can read more from Mac Slavo at his site SHTFplan.com, where this first appeared.

Be the first to comment on "Shocking Chart: Sign of Global Economic Implosion?"